If you've followed along with the progression of Vistaly, you know we're big into visualizing work.
-
How are metrics performing, and what is the work-in-progress driving that performance? – Visualize how it's connected
-
How does what we hear from customers map to the business or product strategy – Seeing it vs. Discussing it
-
How are efforts being weighted, and what are they being prioritized against?
These are all complex problems, and visualizations can help cut through some of that complexity. Whether you're building an app at a small startup or working with several others in a squad at a large organization, having something you can see and interact with will help you make better decisions and bring everyone along on the same ride.
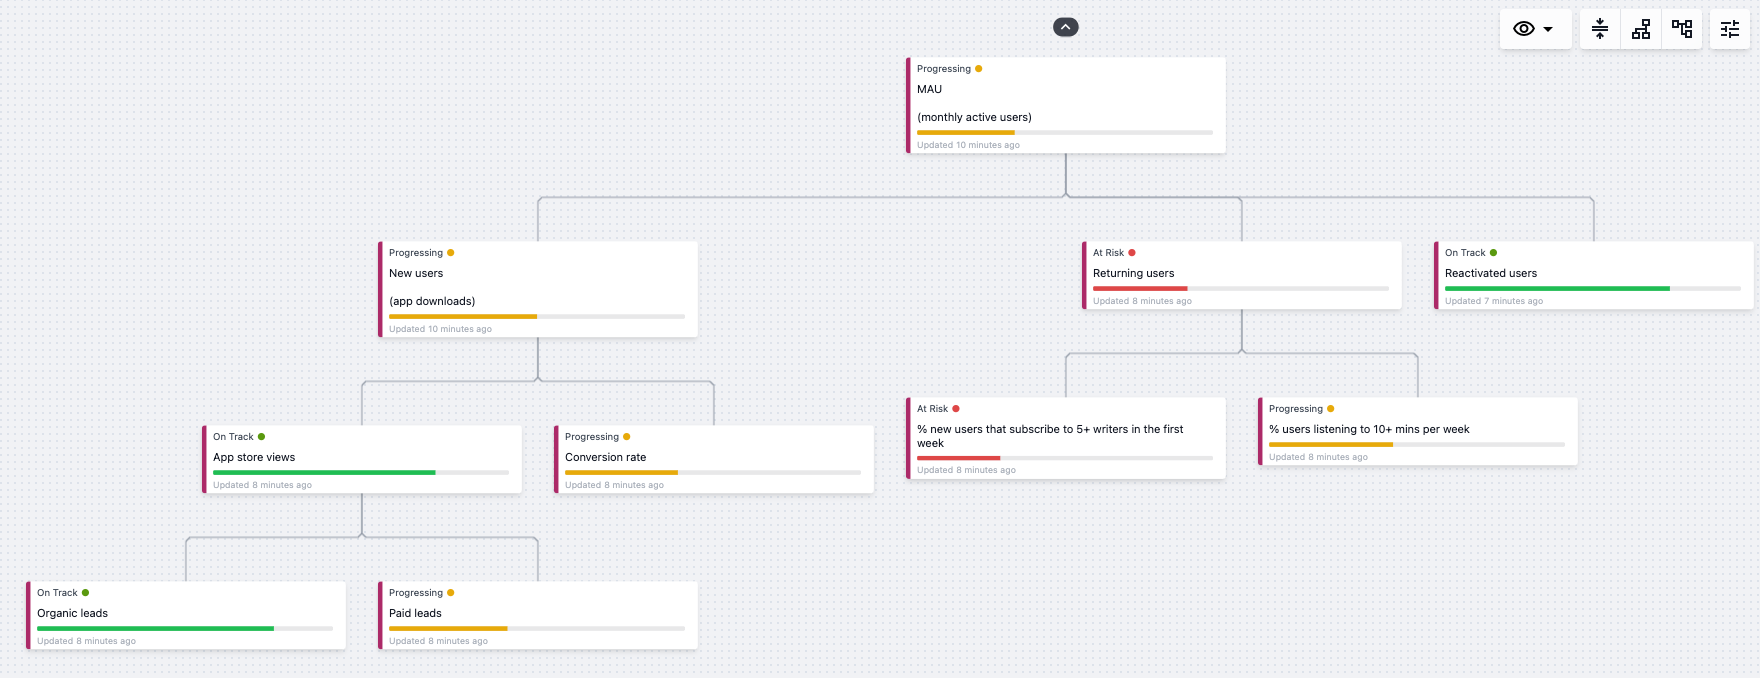
KPI Trees
KPI Trees are great visual models for breaking down more significant North Star styles metrics into sub-metrics and those sub-metrics into smaller ones.
There are several benefits to this approach:
- Transparency
- Alignment
- Ease of influence (It's easier to influence metrics deep in the tree, compared to, say, "Increase MAU")
- Clarify team structures
- Identify organizational pain-points
Shaun Russell and Petra Wille wrote a great piece on KPI Trees with excellent examples. [1]
Bonus 🎉
Here is the example KPI Tree modeled in Vistaly. Track progress & risk (over time), collaborate on your KPI Tree and continue off KPI leaves to model and visualize product discovery.