Overview
This guide is for founders, executives, product teams, and go-to-market leads using data to improve focus, prioritization, and alignment using visual tactics.
A few times a week, metrics, goals, and the many frameworks for implementing them come up in customer calls. This guide is a living reference to support those conversations and act as a visual mapping reference.
One question that comes up frequently is:
"We're using OKRs, Opportunity Solution Trees, North Star Metrics, < other frameworks here >. How do KPI Trees work with those?"
This guide is a visual reference for continually improving metrics using KPI Trees alongside other processes and frameworks.
Read time: 15 minutes
Contents
2. Visualizing metrics (KPI Trees)
4. Using KPI Trees to avoid common problems
5. Popular metric & goal frameworks
Goals vs. Metrics
The term "Metric" is used throughout this guide to represent measurements, whereas the term "Goal" represents the idea of achieving an outcome or target.
Freezer Example
Let's say we are building a new kind of freezer. A freezer is only helpful if it keeps things cold, so we must measure what temperature it can hold.
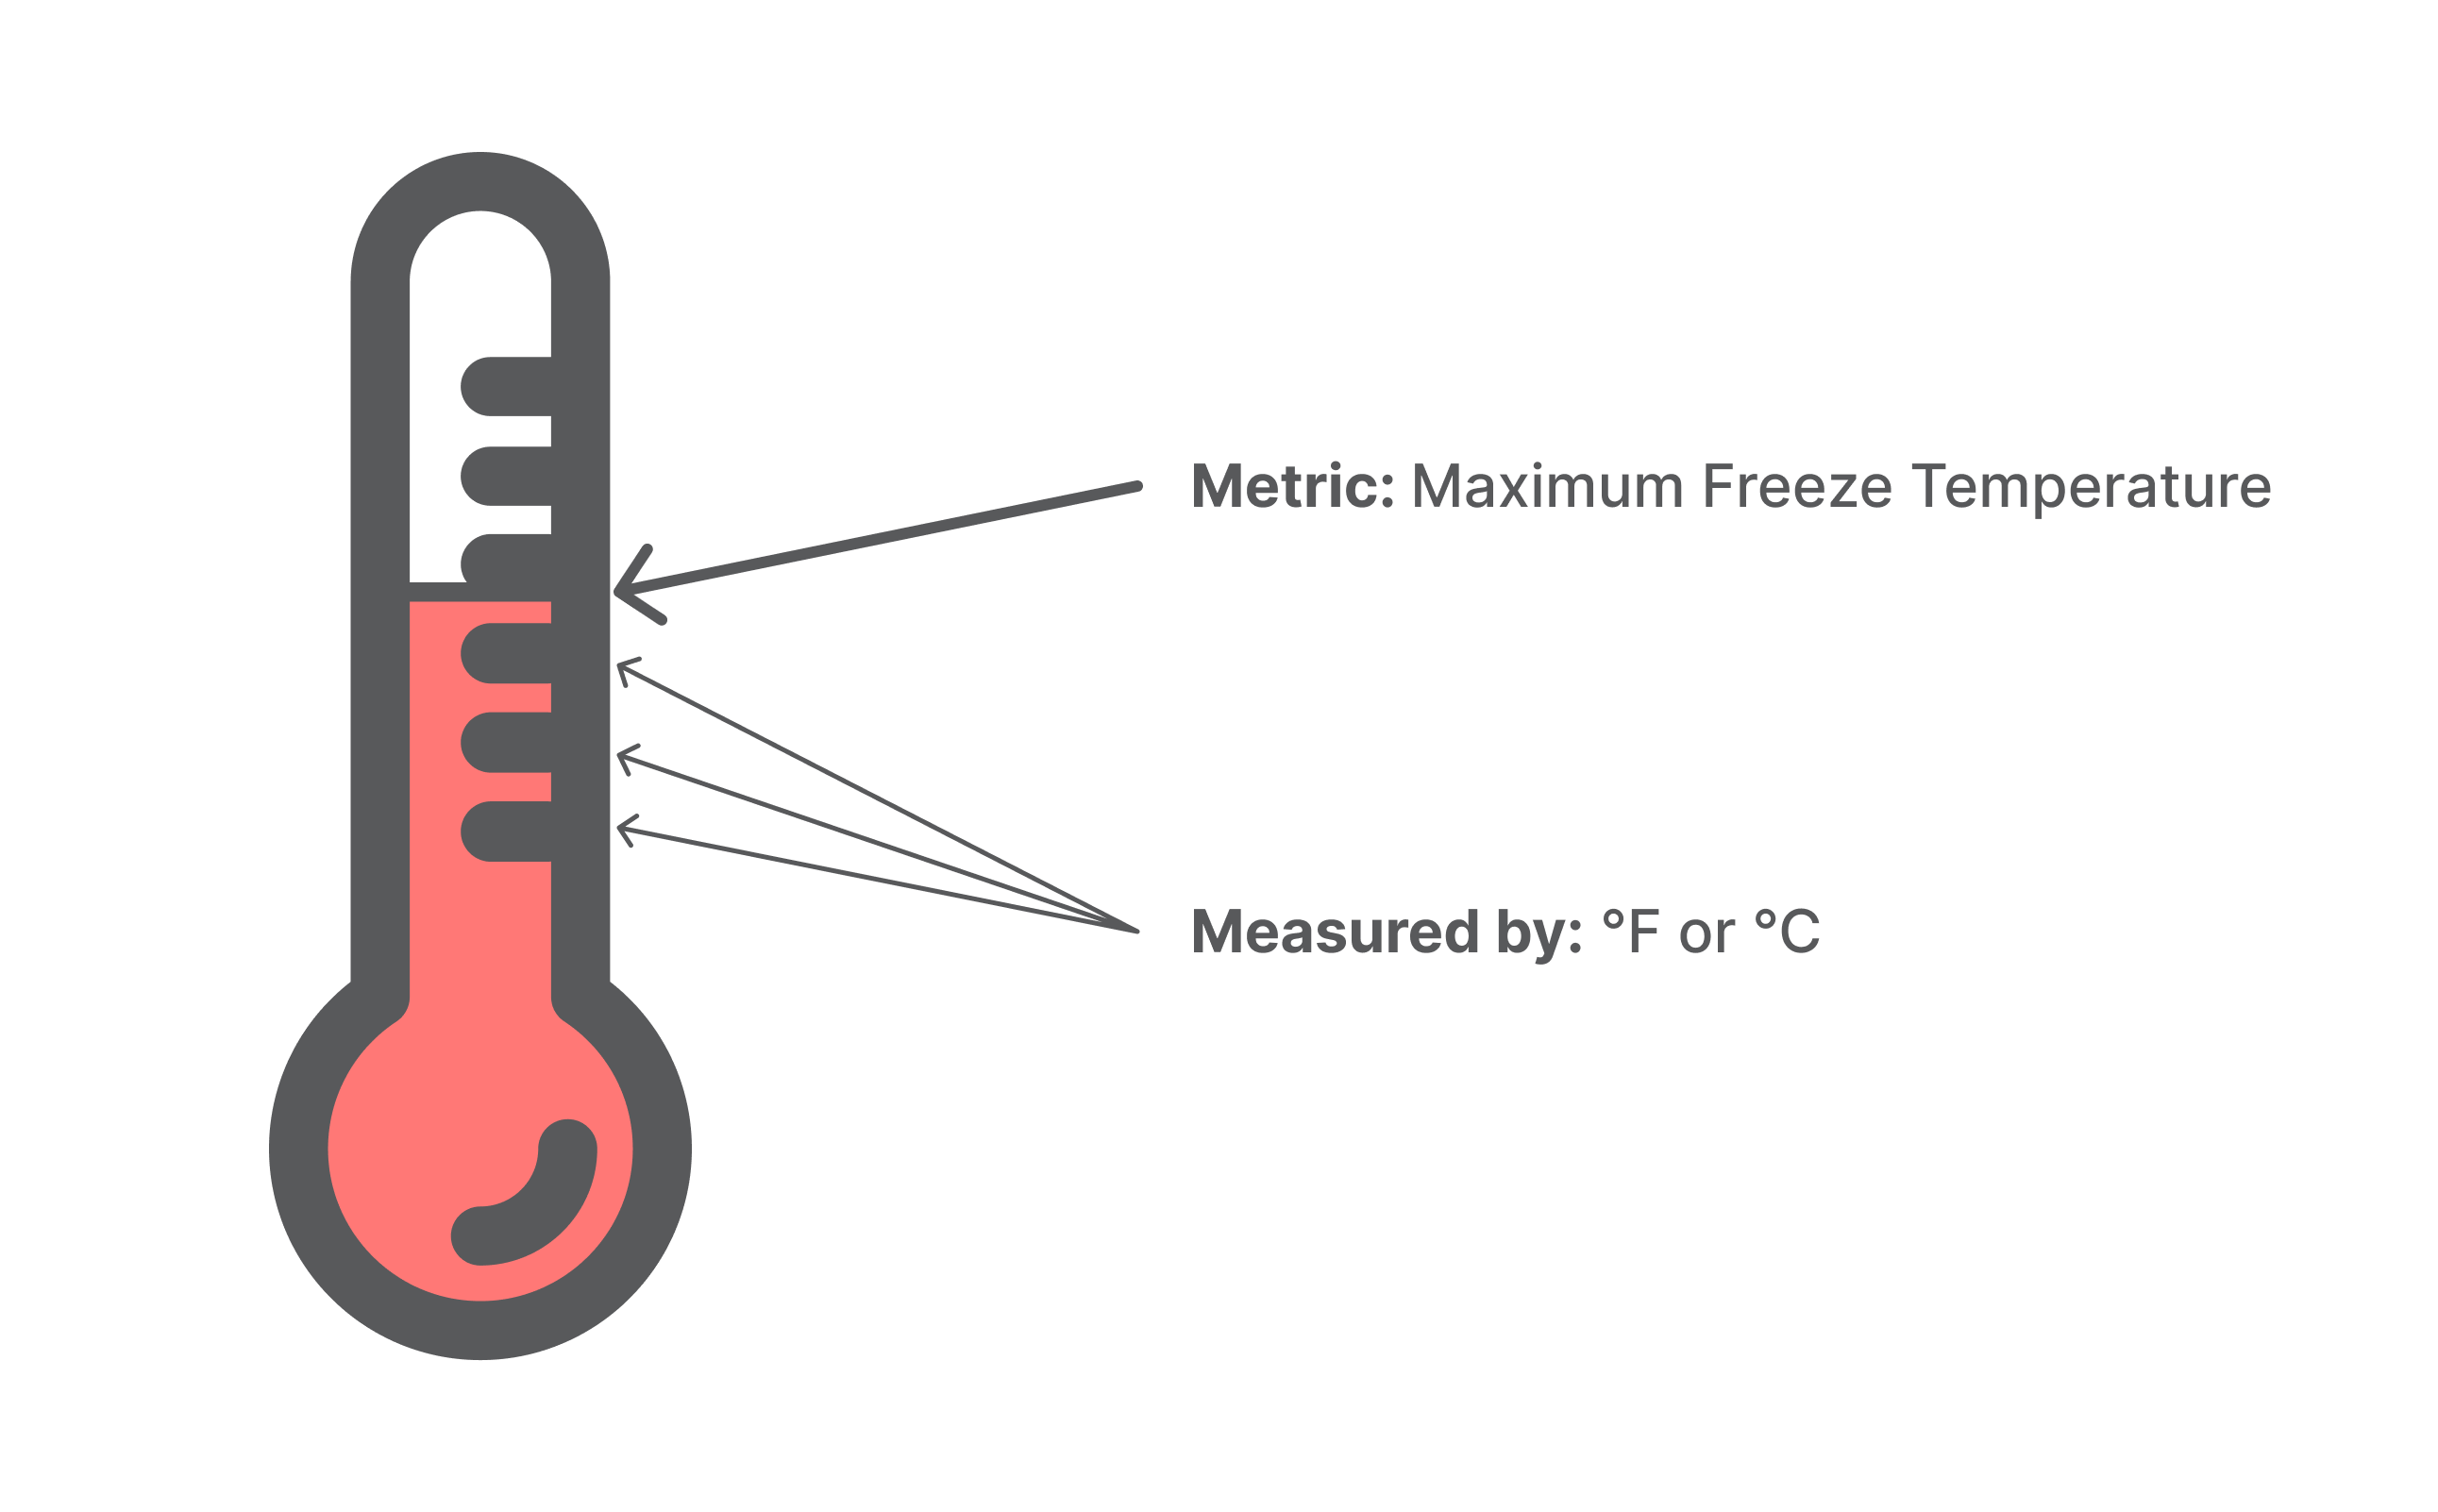
Maximum Freeze Temperature is the metric to communicate how cold the freezer can hold a temperature.
Let's say we run the test and find it keeps items cold at 50 °F (10 °C). That's not going to be a useful freezer, and we probably should get out of the appliances business – that, or we need to fix it.
Goal: Achieve a Maximum Freeze Temperature of 0 °F (-17.78 °C).
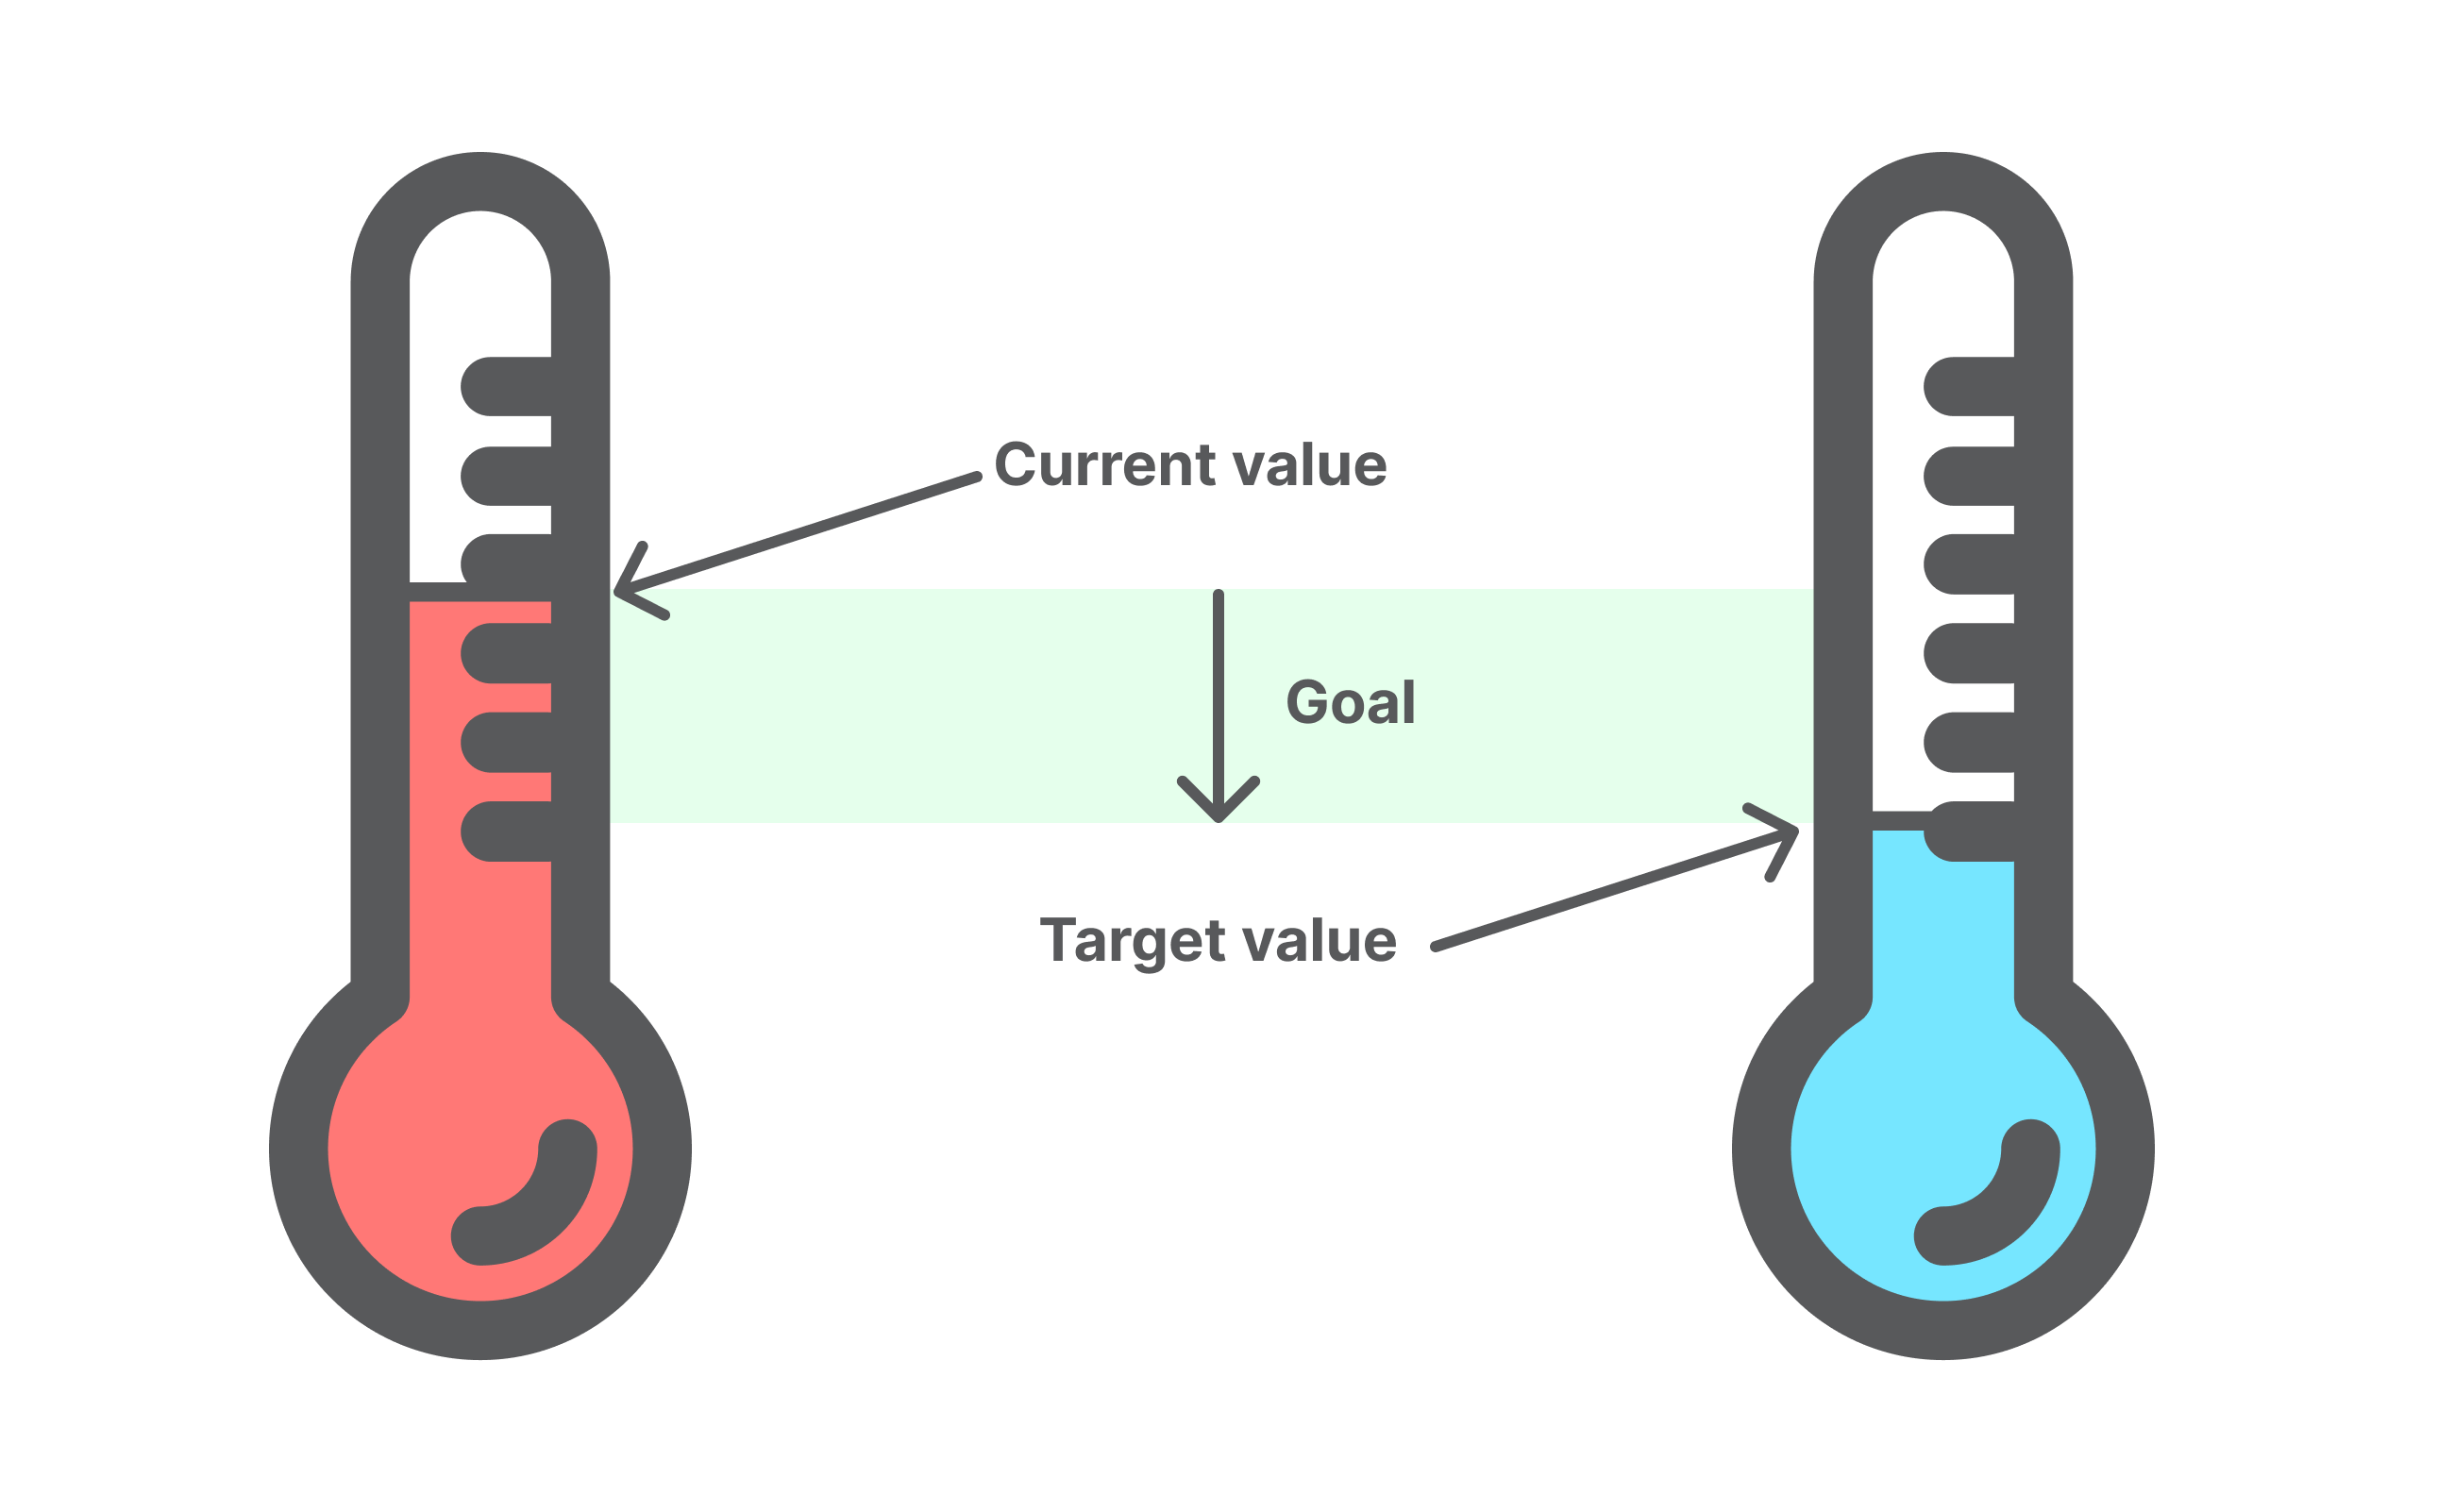
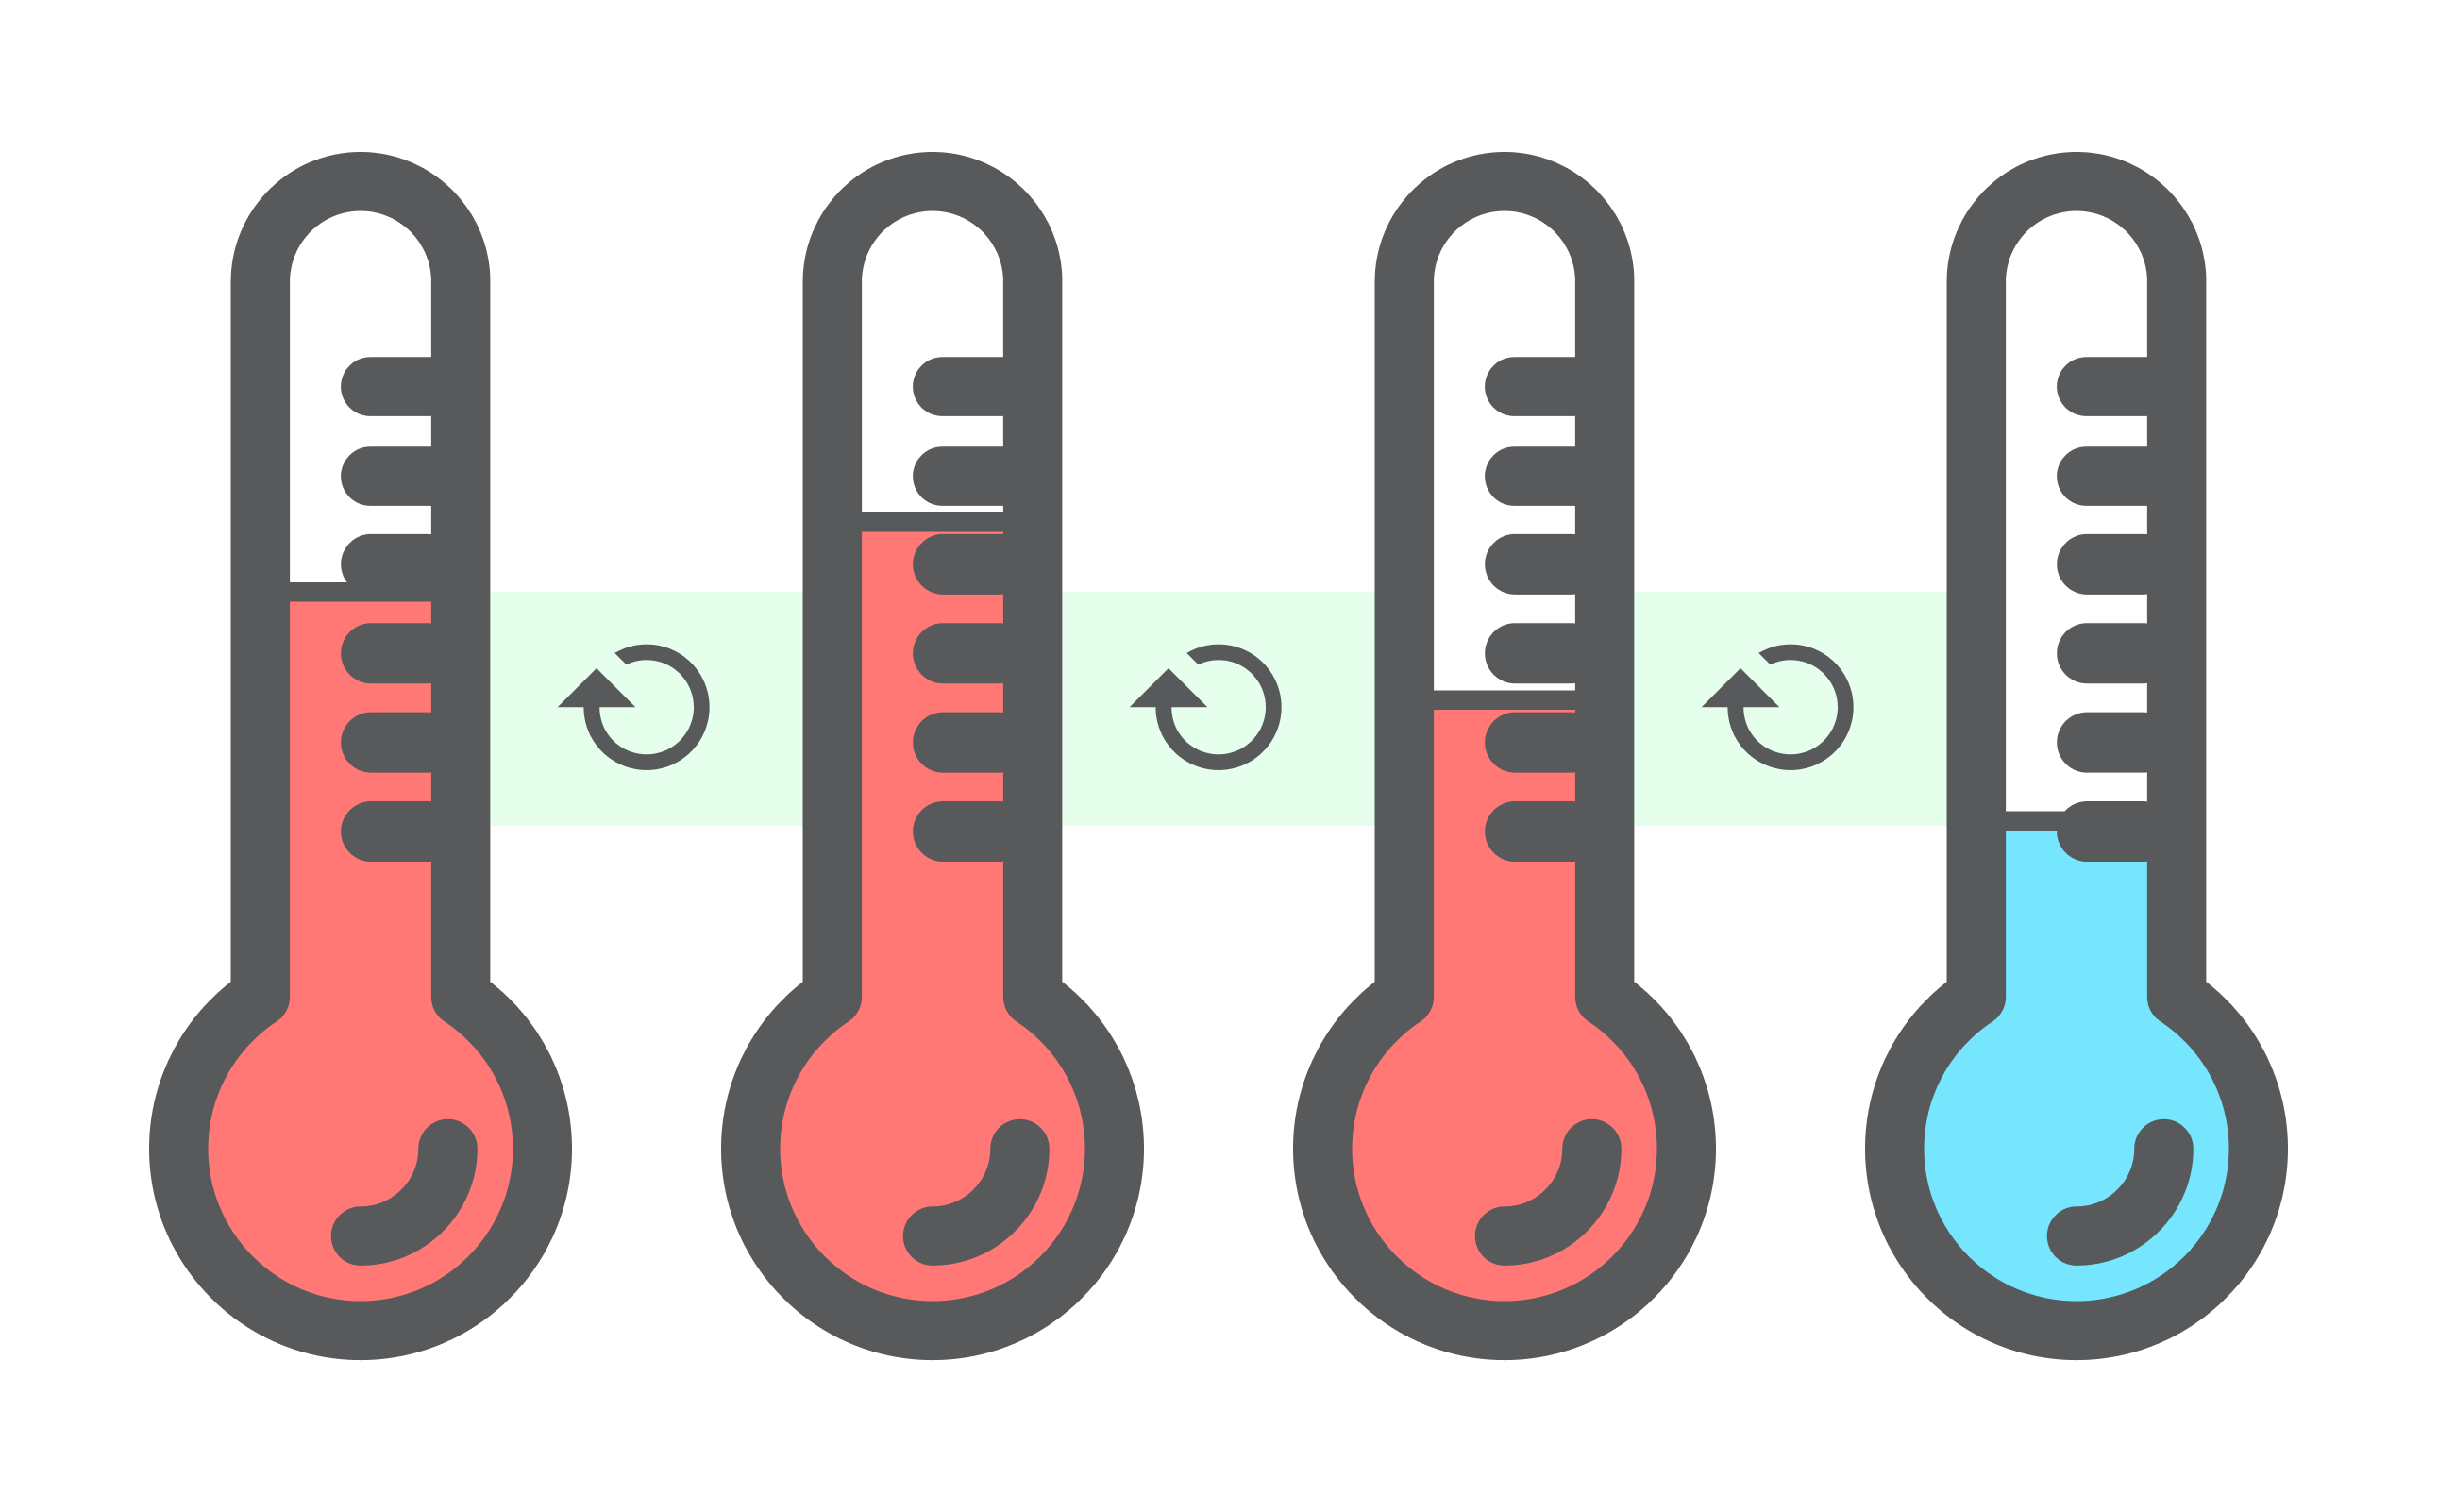
With a goal in place, we now have a feedback loop and method to track progress as we iterate on the design.
The goal also communicates a clear definition of done. Once the goal is reached, there is no need to continue, especially when entering the realm of diminishing returns.
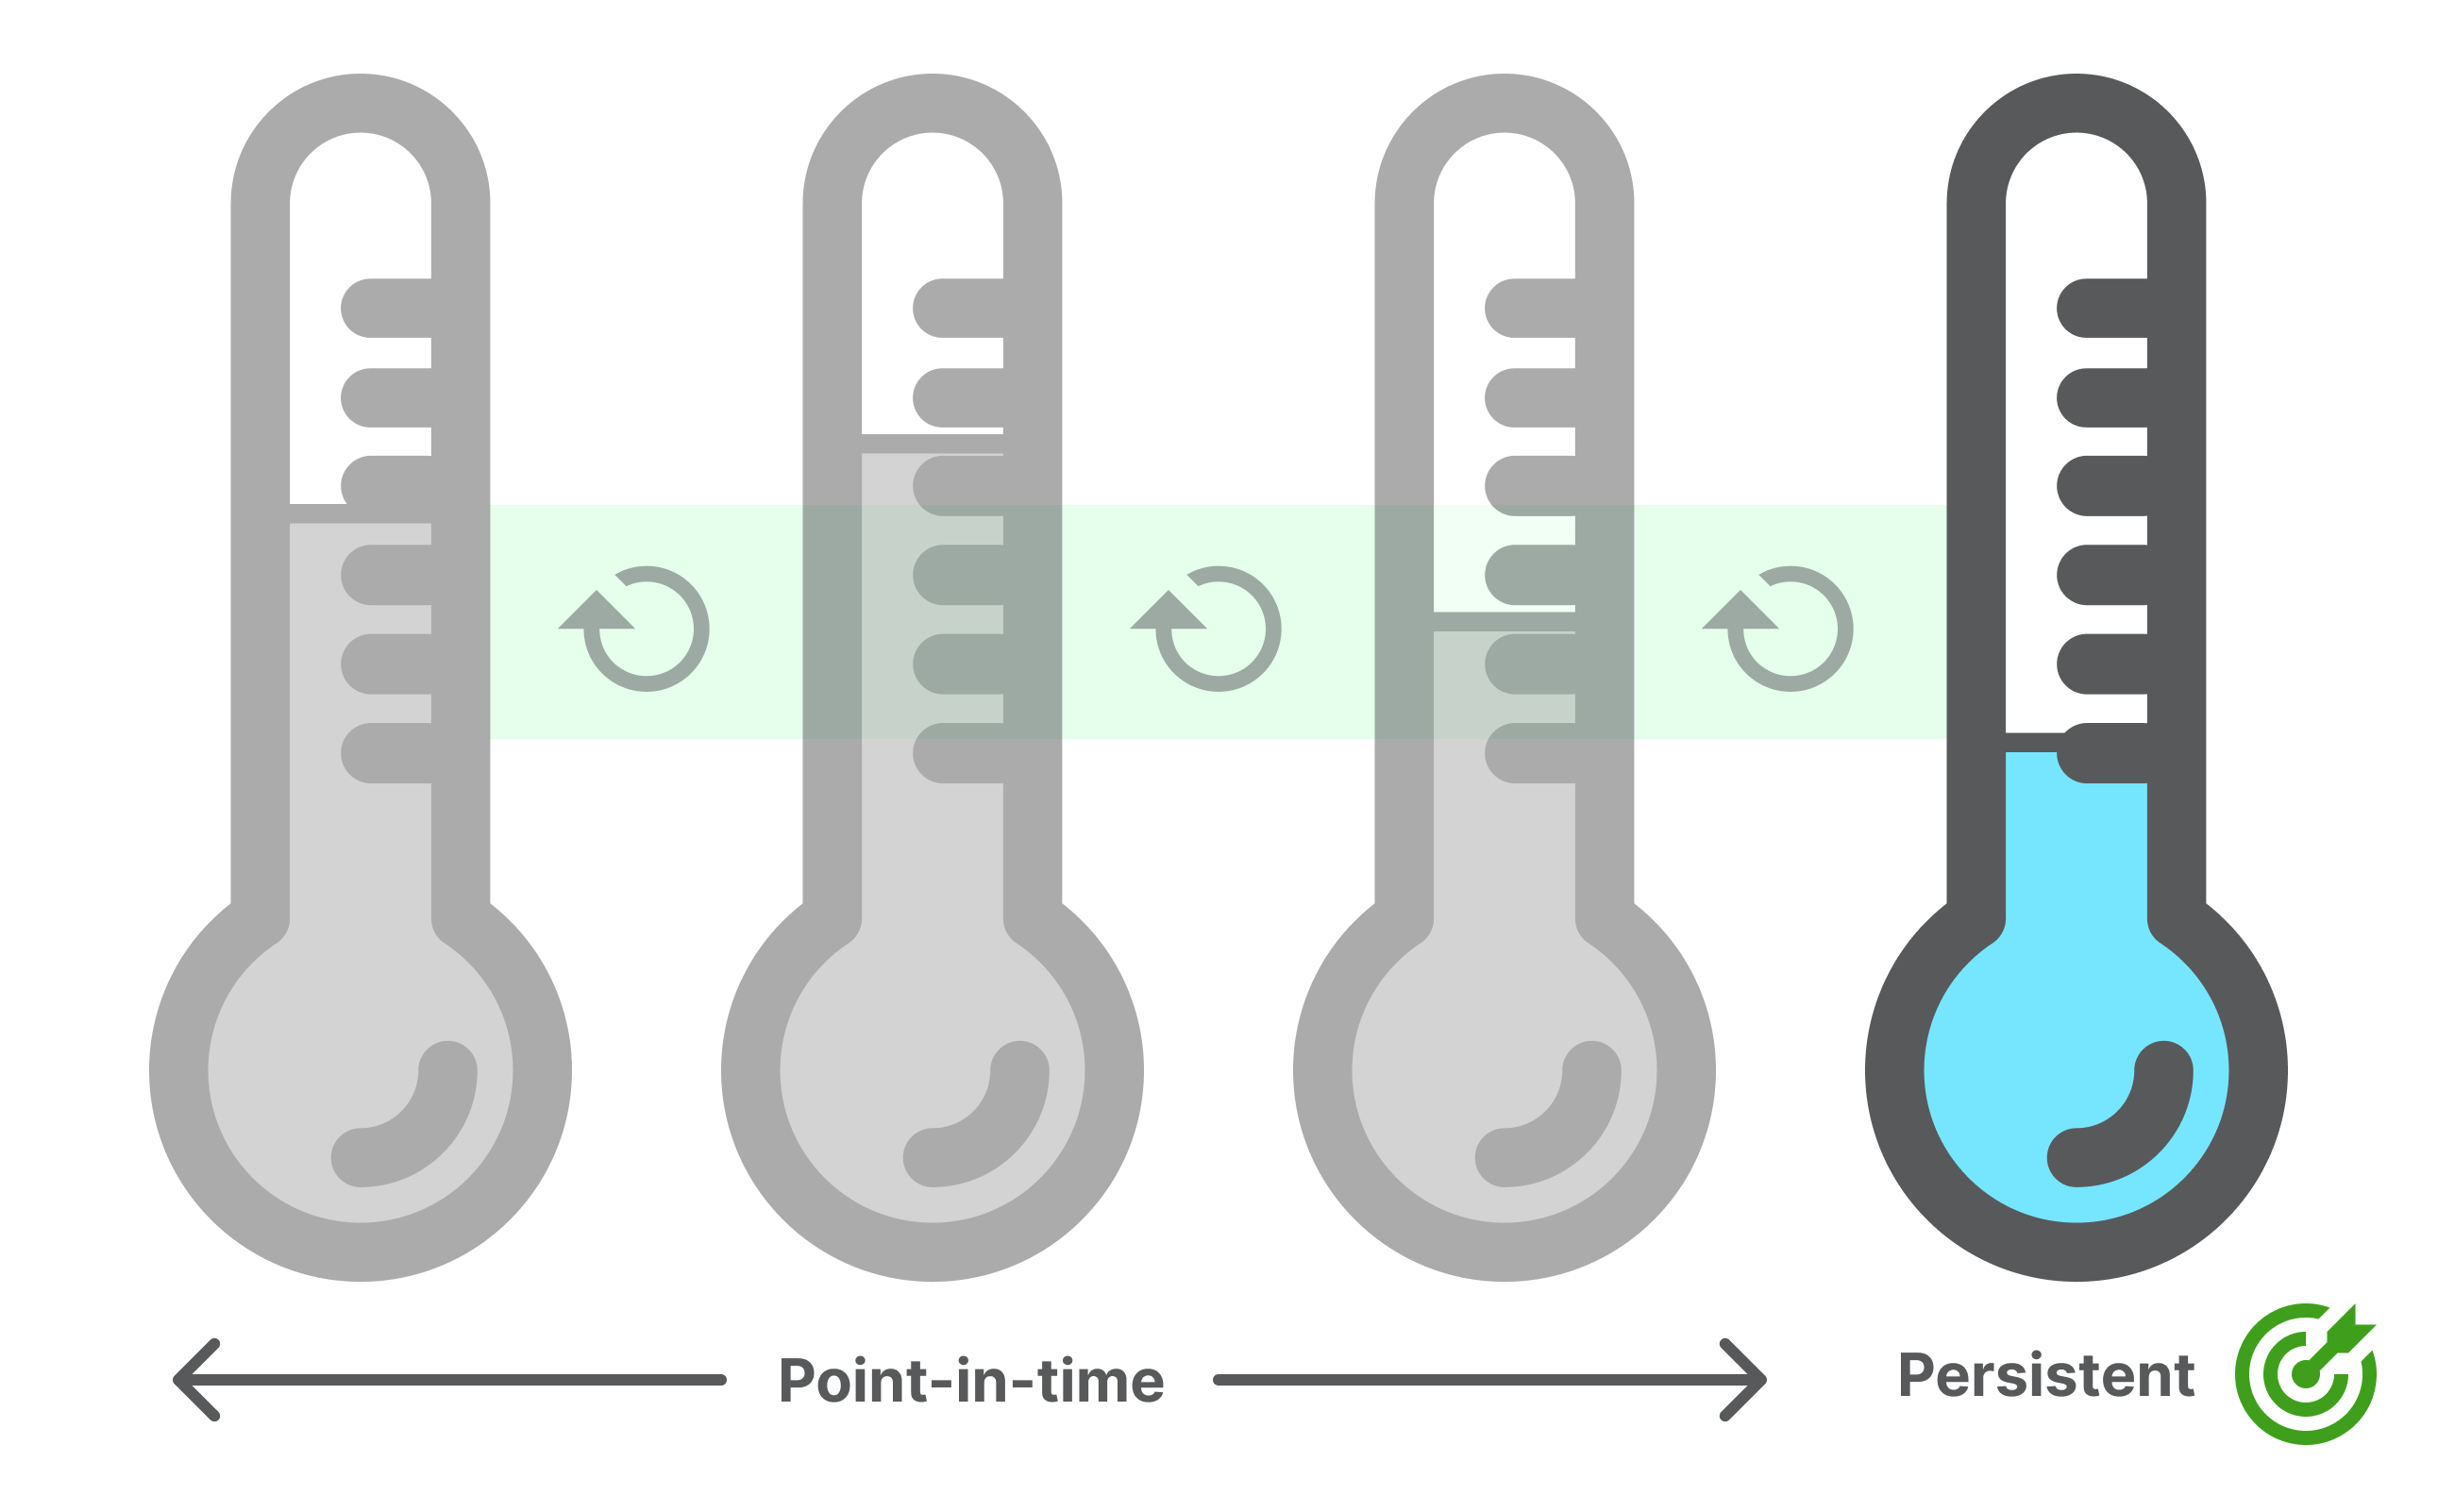
Persistence vs. Point-in-time
Metrics can persist long after a goal has been reached, while goals tend to only be useful at a specific point-in-time.
If you're looking for a freezer to store medical supplies, you probably want to know if the freezer can maintain a specific temperature.
Maximum Freeze Temperature is essential, but you don't need to know how long it took engineers to develop it. The metric has persistent value, and the goal is only important at a point-in-time.
There are many persistent metrics you can track. Depending on the stage and type of company, they may vary. Here are standard persistent metrics tracked by many companies to measure health, growth, and product/service performance:
- Lifetime Value (LTV)
- Monthly Recurring Revenue (MRR)
- Retention rate
- Conversion rate
Visualizing Metrics (KPI Trees)
Metrics are valuable for understanding how individual parts of a larger system work but can struggle to tell the larger story.
You may have experienced a time when the same dataset was used to tell two completely different stories. The data is not different, but the added context and how it's applied changes the story.
This illustration by Jeff Patton always hits close to home.
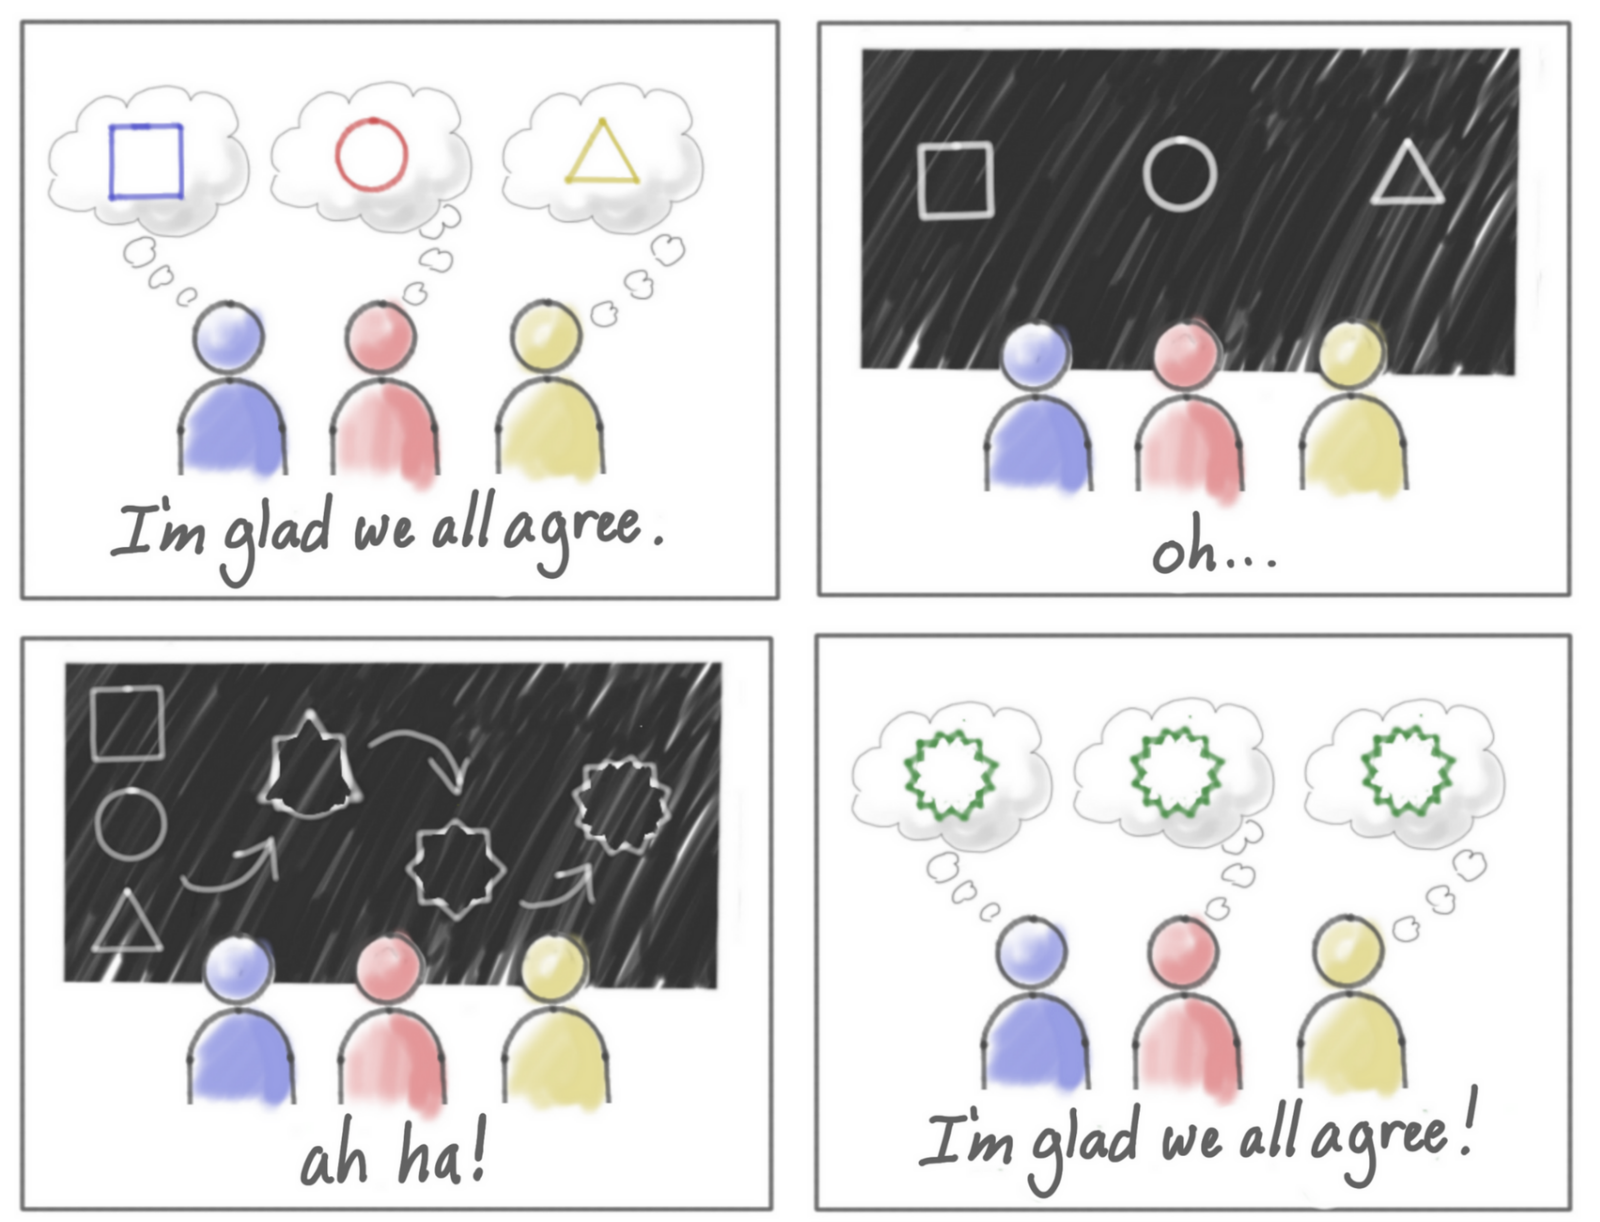
Dashboards and spreadsheets are prolific for tracking metrics, but they often do a terrible job with context (how they are used and why they matter). Adding context typically happens in meetings, slack conversations, and presentations. This helps everyone construct mental models for interpreting the metrics.
The problems with mental models
Everyone has their own mental models, and they don't always line up (highlighted by Jeff's illustration above).
Mental models are also hard to share, creating barriers for new team members. Breaking metrics into smaller parts and visualizing how they fit together takes the mental model of 'how the business works' and turns it into a physical one. This physical model can be used as a tool to address alignment, focus, and comprehension challenges.
KPI Trees
A KPI Tree is a tool for visually managing the context surrounding the most essential metrics influencing a service or product. KPI Trees visually represent how 'things' work as a model.
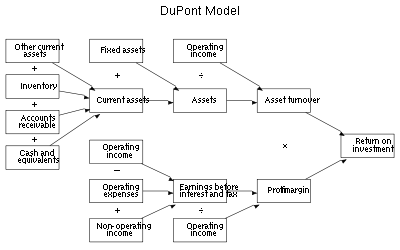
One of the earliest versions of a KPI Tree comes from the 1920's DuPont Analysis on visualizing ROI.
Several frameworks have been used in business contexts to visualize how metrics influence one another to create value. KPI Trees, Driver Trees, North Star Metrics, and Impact maps are a few.
Building a KPI Tree
When getting started, I like to begin at the top of the tree (or as close to the top as possible). KPI Trees visually represent how 'things' work, so having the top of the tree present is a constant reminder of what is being optimized. Then, I start asking questions to uncover anything that has the potential to influence it. I don't worry about getting everything right in the right places. It's more about getting everything out there first and refining it later. Most of the top-level metrics I see are monetary, growth, or a high-level product engagement metrics.

Note: If you don't start at the top, that's fine. Asking, "Why does this metric matter?" will help expand the tree up when you're ready.
Here are prompts to help get everything out there and build the first pass of your tree.
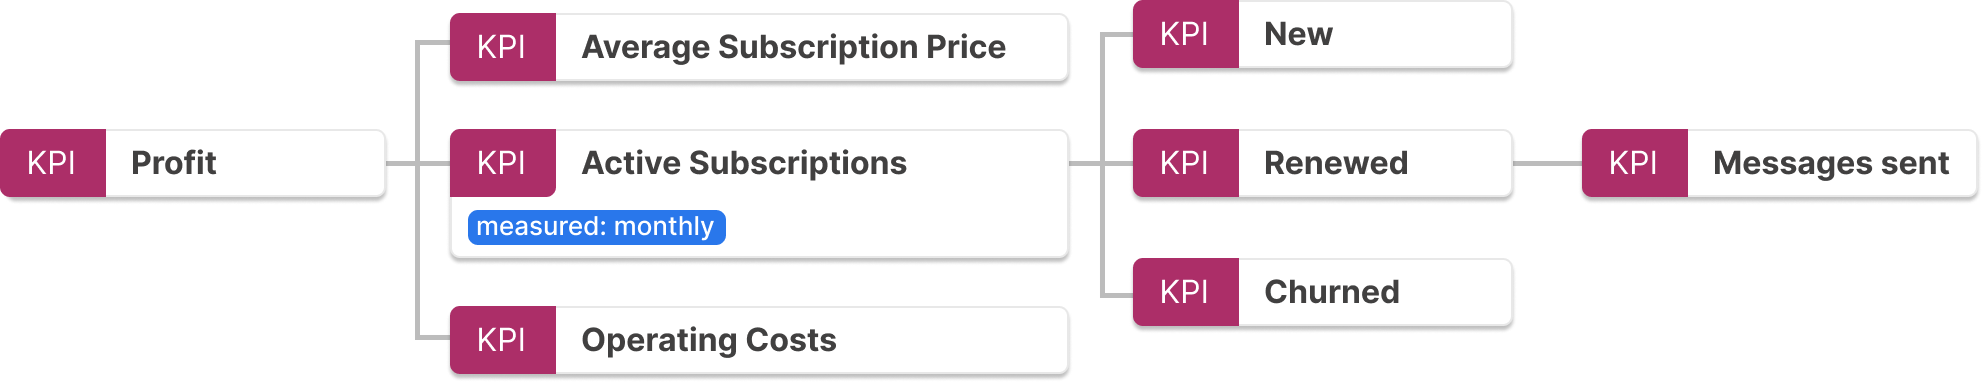
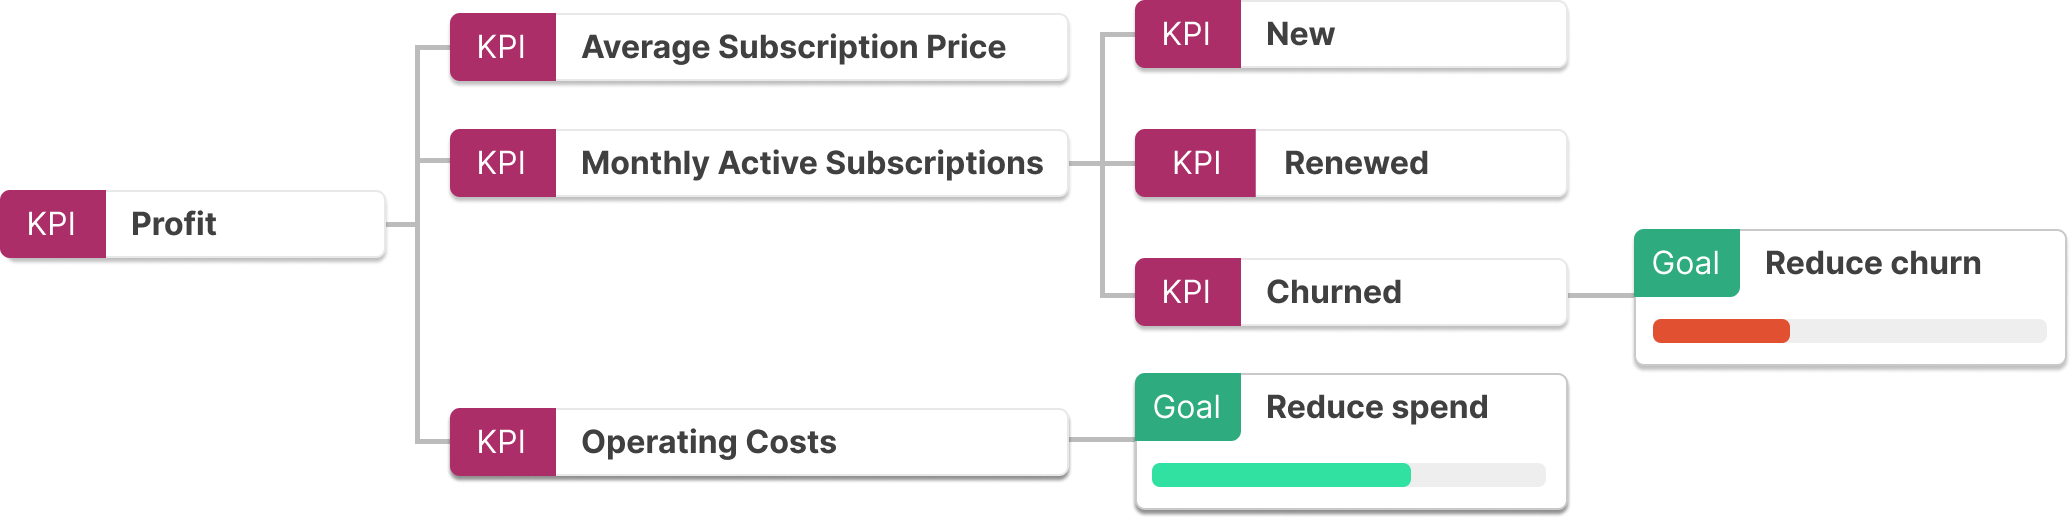
To expand the tree down, ask, "How does profit grow?".
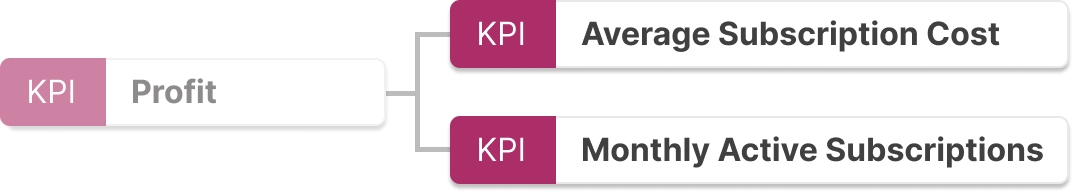
In this example, profit can increase if the number of subscribers increases or if the average subscription cost goes up.
Inverting the question can account for drivers that decrease value. "How does profit shrink?"
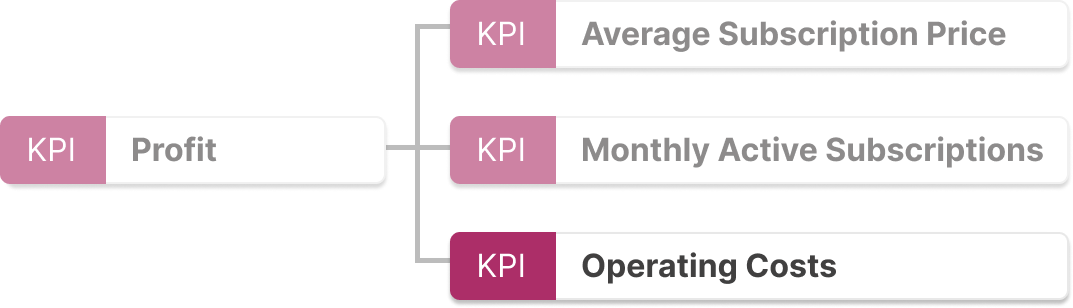
Average Subscription Price, Monthly Active Subscription, and Operating Costs are all input metrics to Profit.
This process can be repeated at each level to visualize how inputs influence metrics and how other metrics influence inputs.
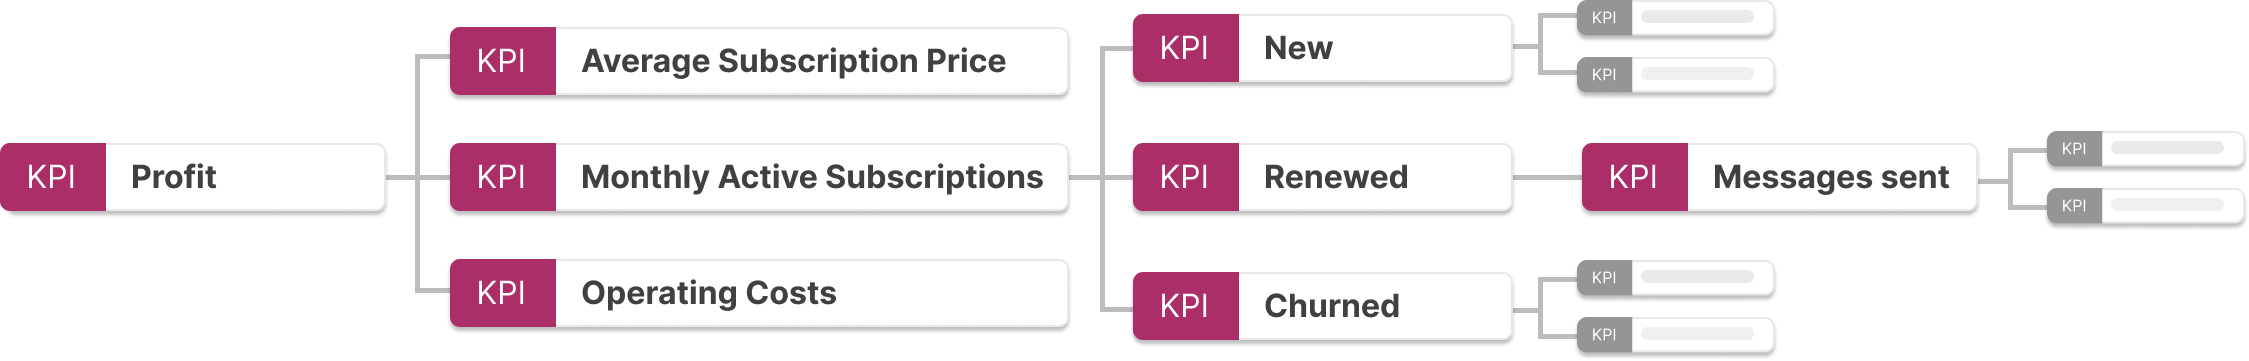
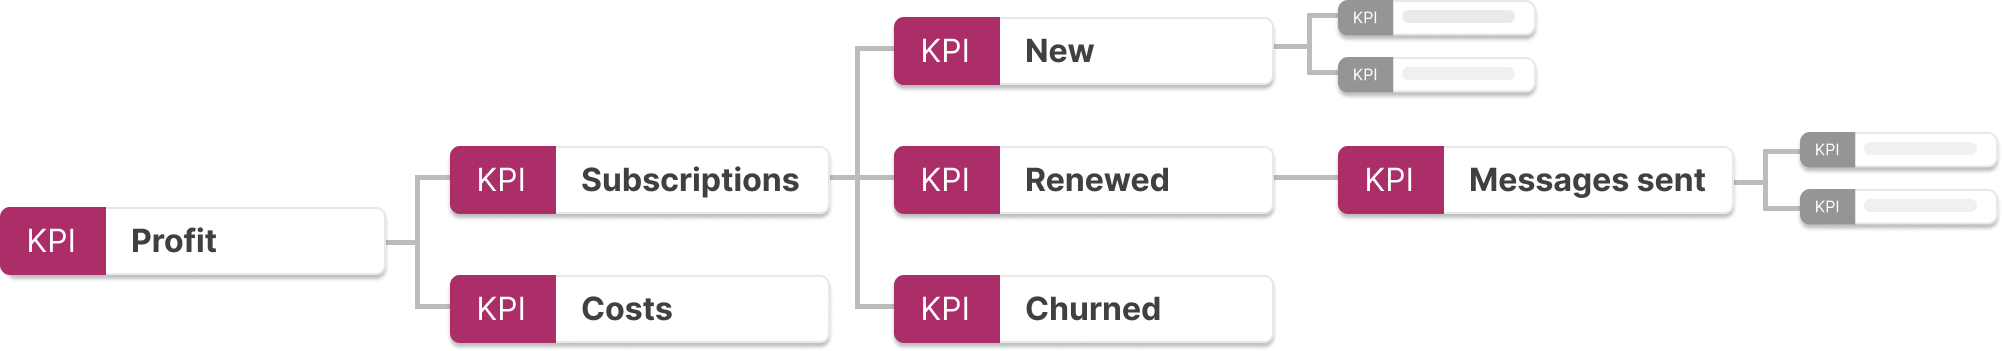
Tracing value
Looking left to right, you can examine each lever for influencing revenue.
And looking right to left, you can understand how something closer to the edge can influence the bigger picture.
For example, if we're managing a messaging application like Slack or Teams, we can answer the question: "Why does increasing the average number of messages sent per user matter?"
Measurement frequency
We've found it helpful to indicate the reporting timeframe of a metric and leave the frequency out of the name. This will avoid confusion when the tree is shared.
Using the previous example, Monthly Active Subscriptions turn into Active Subscriptions, and the label measured monthly is applied. Adding similar labels to each metric will help others follow along.
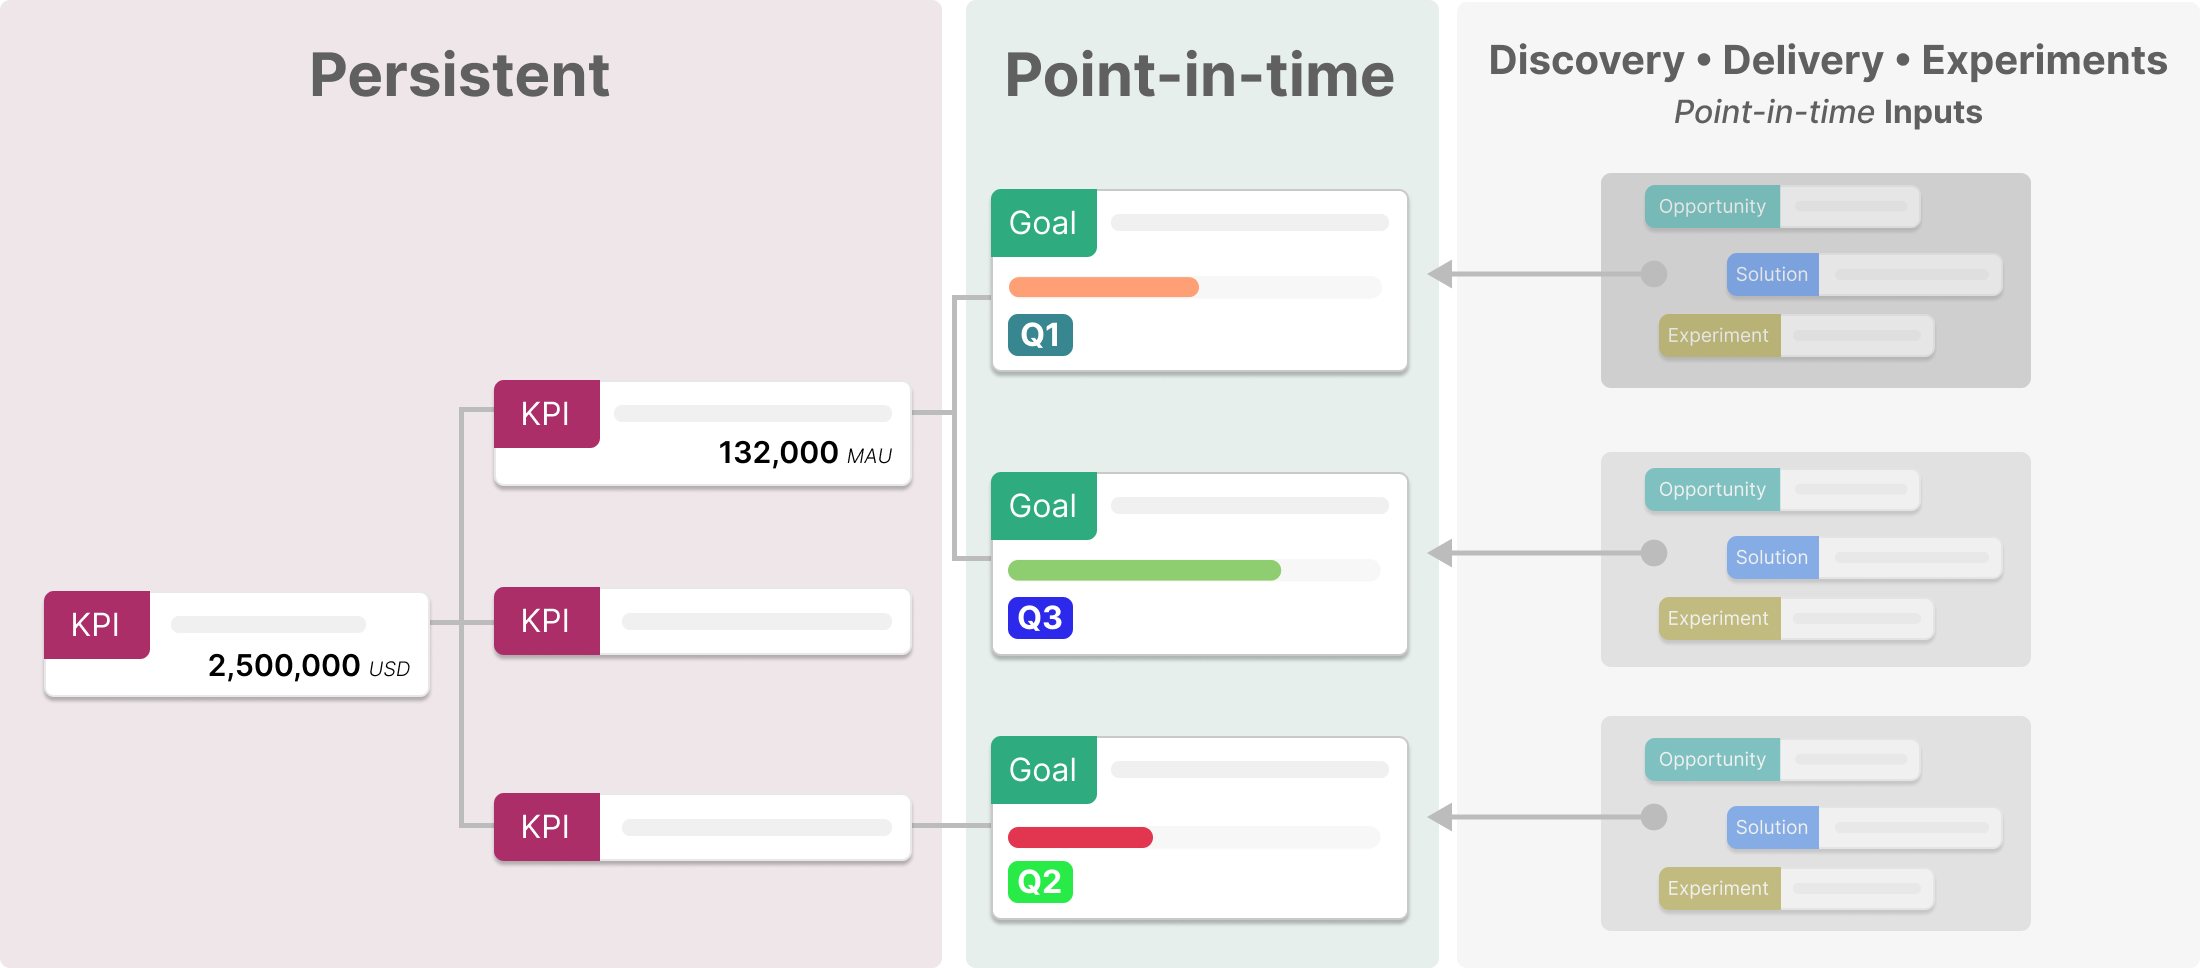
Layering goals
You may have experienced a time or two when all you are doing is defining, negotiating, and communicating goals rather than delivering value. This is one symptom of not having a shared understanding of how 'things' work, leading to spending more time aligning and executing less.
When a team operates from a shared model, it's easier to negotiate where to invest time. When the shared model is visual, they can point to a specific area and skip the whole 'getting on the same page' step.
If KPI Trees show how 'things' work –– goals describe the next best version of how 'things' work.
Combining KPI trees & goals can save (what I'm sure will feel like years) of your life by providing a clear, agreed-upon starting point that doesn't evaporate each quarter.
Pick an area, set a goal, and go.
The KPI Tree is the starting point – it's persistent. The goals create a point-in-time focus to improve the goal. Everything to meet the goal (discovery, delivery, experimentation, etc.) falls under the goal.
Using KPI trees to avoid common problems
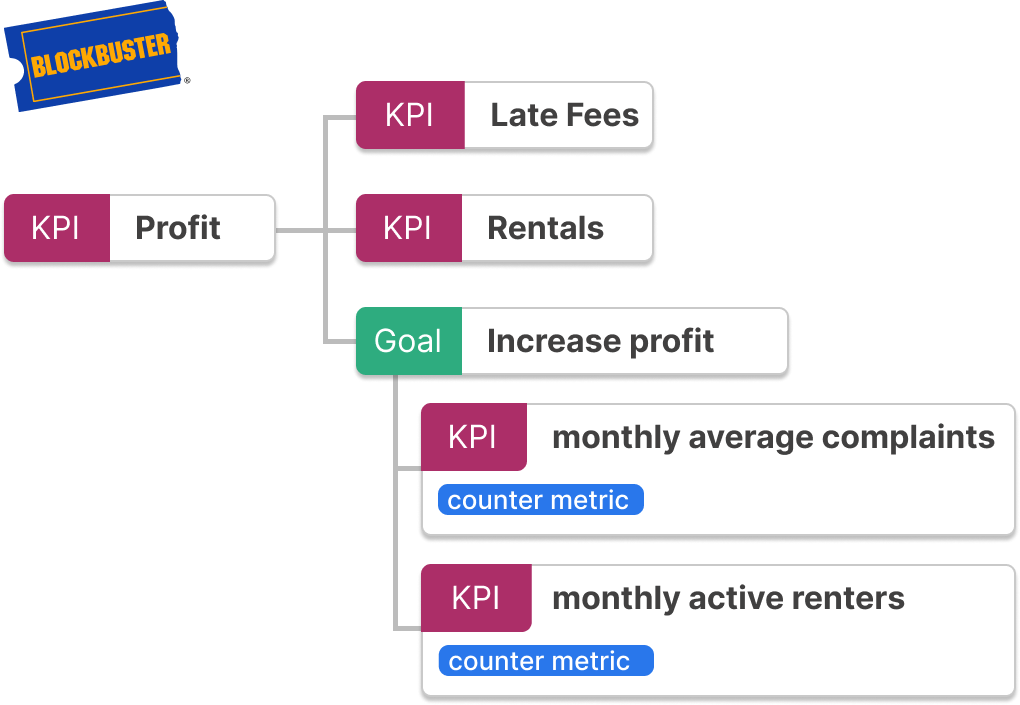
No counter metric – (Win/Lose)
Focusing on a goal at all costs can result in negative consequences if you don't look at the bigger picture.
Blockbuster increased their revenue by charging rental late fees, which accounted for 16% of the company's revenue, angered customers (Reed Hastings being one), and even led to a lawsuit.
Fixing the problem
Counter metrics help balance short and long-term trade-offs. Blockbuster had an easy lever to pull to increase revenue, but it came at a cost.
"For each success metric, come up with a good counter metric that would convince you that you’re not simply plugging one hole with another."
~ Julie Zhuo, Former Meta VP – Product Design
When setting a goal, ask the question: "What are we potentially giving up to focus on this goal?"
- Speed for quality
- Revenue for satisfaction
- Total users for engagement per user
Link (or add) counter metrics to the goal in your tree. Use them as guardrails to monitor alongside progress.
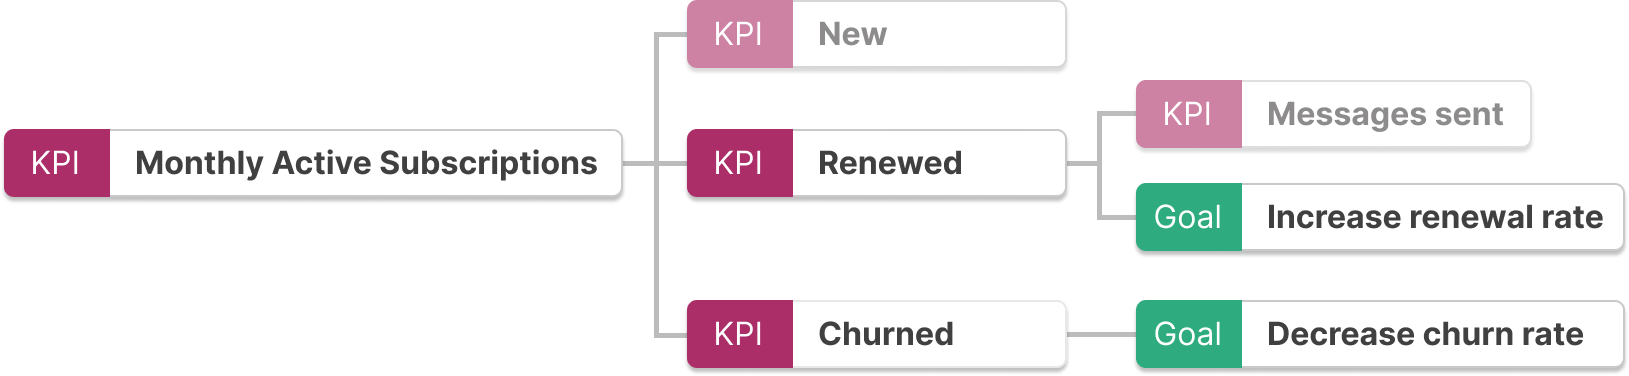
Assigning goals too "high" in the tree – (Lagging metrics)
Attaching a goal to a metric higher in the KPI tree will be harder to influence. High-level business metrics have longer lead times. If you can snap your fingers and increase profit by 50% without serious negative trade-offs – 👋 Blockbuster, you can safely stop reading now.
The challenge with goals attached to lagging metrics is that they almost always require research and action from multiple business areas to influence them. Likely, these other parts of the business are not used to working together, and they may even have different goals of their own, competing for time. This is a cross-functional collaboration challenge.
Fixing the problem
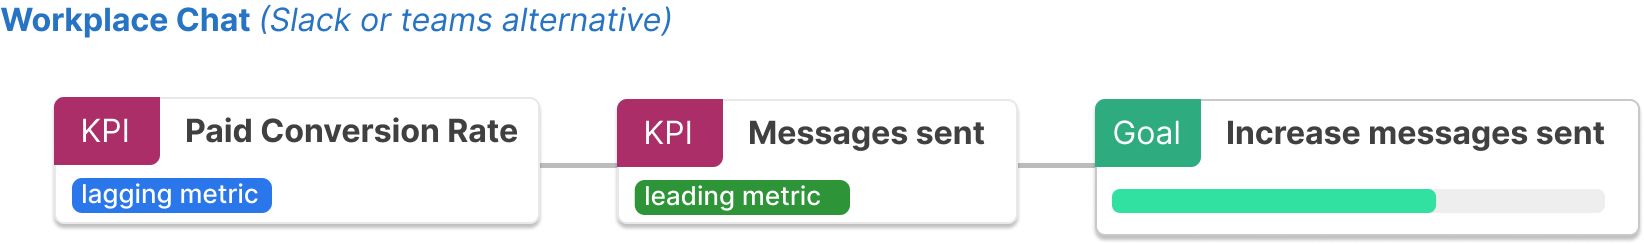
Individual product trio's goals should be set down the tree on the leading metrics that actually drive the up-the-tree business impact.
The further down the tree a goal is applied, the more focused the work and the shorter feedback loops.
Here's how you can model the relationship between lagging business metrics and leading product metrics 👇🏼
Ship and forget – (No feedback loops)
"Ship & forget" is a symptom of delivering a lot of work without creating the anticipated value.
Fixing the problem
It takes time to see change. When tasks or development tickets are the only way of tracking "done", it's easy to equate shipped work to value added.
Layering goals into the tree creates focus and acts as the benchmark for actual progress. Setting weekly or bi-weekly touchpoints to update or reflect on progress will help determine if prior work requires iteration.
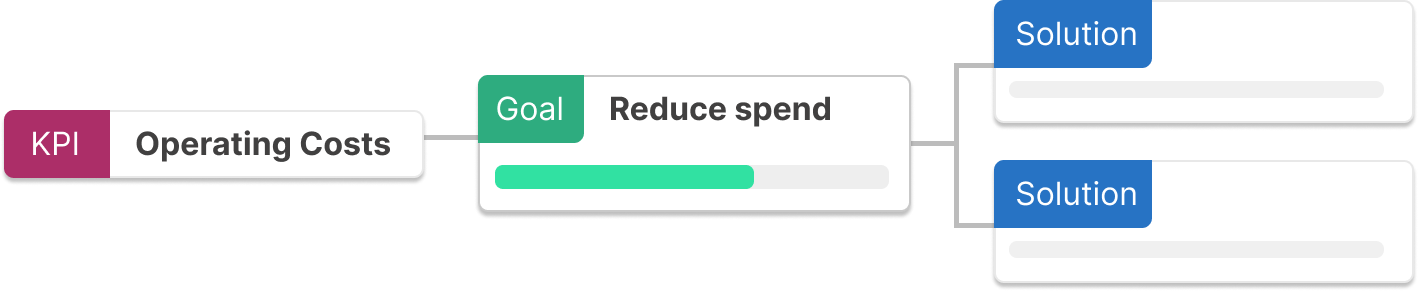
Extending the KPI Tree to include projects or solutions can be a visual reminder of previous work completed when reviewing goals.
Extra resources:
- Escaping the build trap – great book on the topic – with tactics.
- Scaled Feature Factories – post describing the problem and symptoms.
- Opportunity Solution Trees – a visual framework for leveraging product discovery tactics to achieve outcomes.
Inability to move the needle – (No correlation)
Setting goals on leading metrics has many benefits, but like most things, it has trade-offs. When improvements to leading metrics do not result in long-term gains, time is wasted.
Let's say you are building an app, and it has a free trial period. You hypothesize that users who take a specific action while in the trial are more likely to pay for the product when the trial ends. You decide to invest in encouraging users to take this action more often.
When spending time improving the engagement metric does not improve conversions, there is no correlation between the work done, and the desired outcome.
Fixing the problem
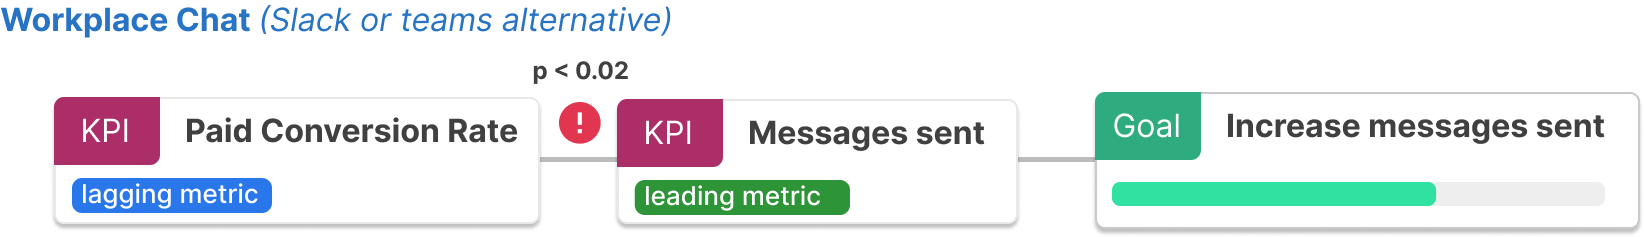
If you have data, correlation analysis can show how connected two metrics are or are not. This post does not go into the details of correlation analysis, but if you recognize this as a challenge, check out the linked resources at the end of this section.
Since every relationship between KPIs is not causal, annotating the correlation between relationships (similar to what is done in the image above) can help determine if and when the model needs to be adjusted.
Aligning expectations on how metrics influence one another is one thing. Aligning expectations on which solutions will maximize impact is another.
"Problem-Solution Fit - this occurs when you have evidence that customers care about certain jobs, pains, and gains. At this stage you've proved the existence of a problem and have designed a value proposition that addresses your customers' jobs, pains and gains."
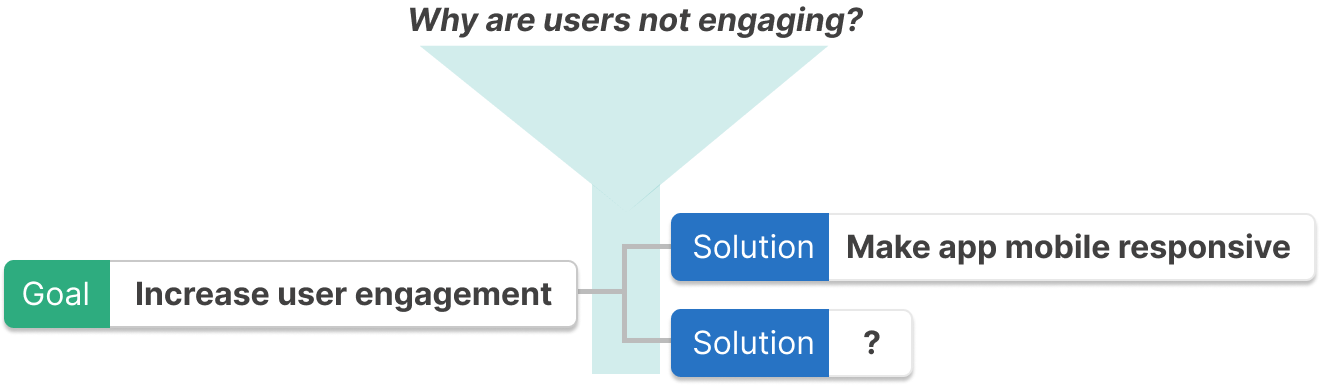
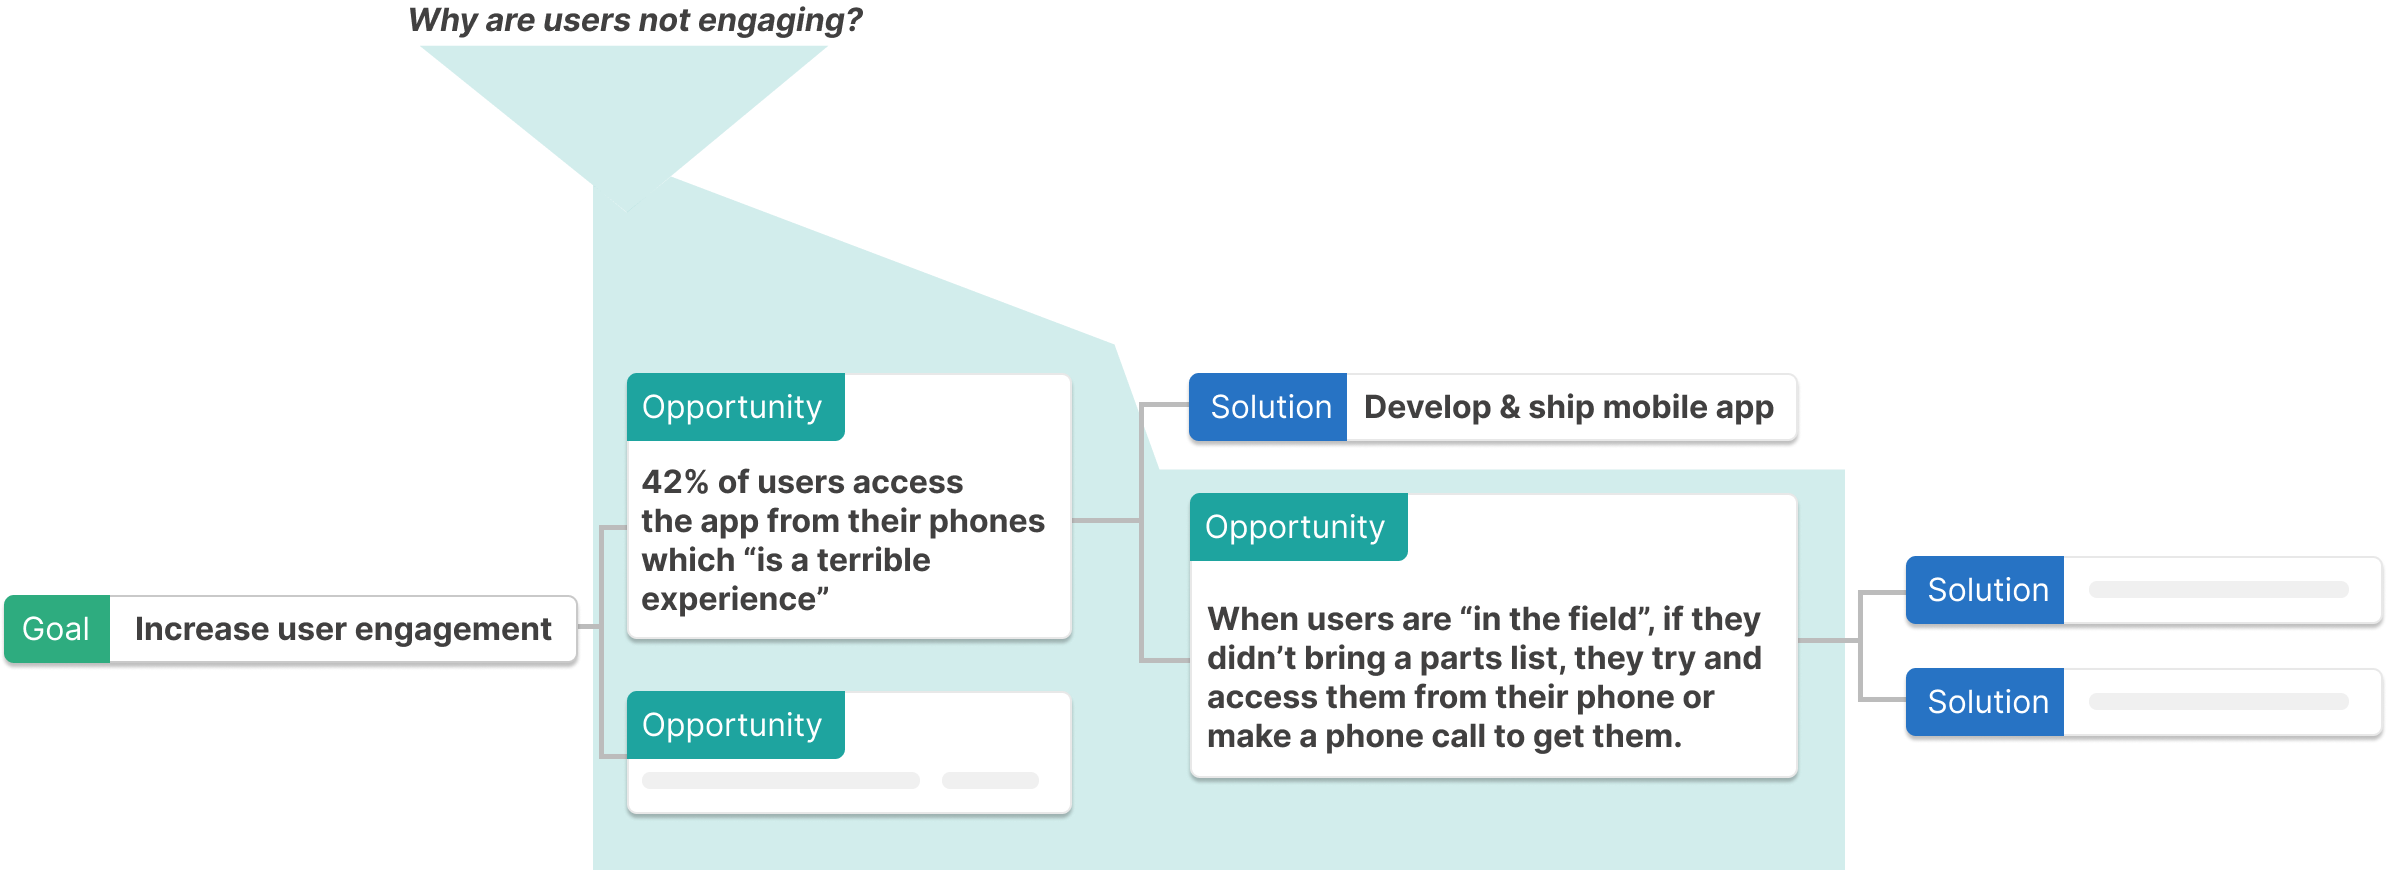
Discovery bridges the gaps between goals, customers, and deliverables. It connects the dots between the various opportunities (pains, gains, barriers) to the ideas for addressing them.
Mapping customer pain points as opportunities between the goal and a list of solutions creates a visual map of unmet needs. The expectation is that once they are met, the goal will progress.
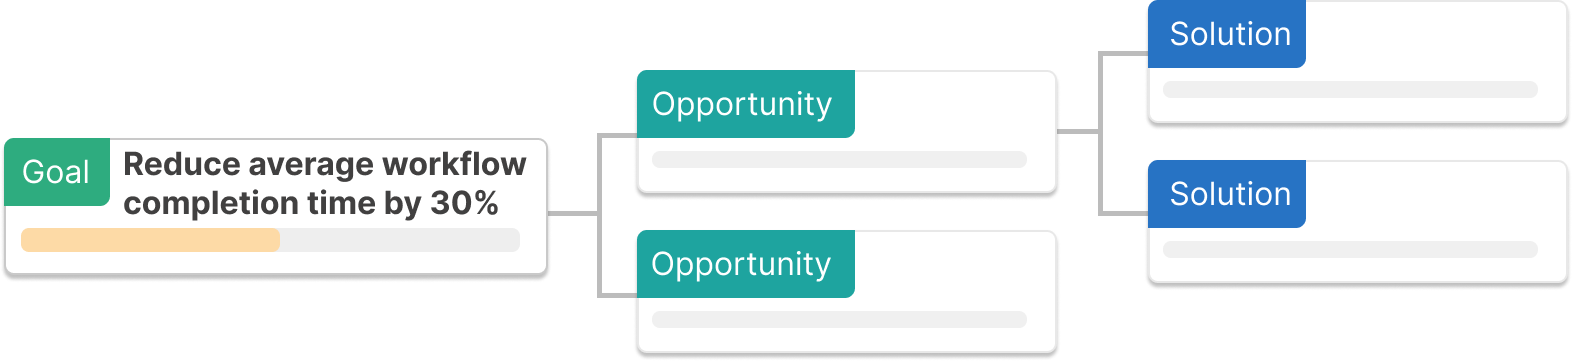
Jumping straight from goals to deliverables assumes that the problem space is well understood by you, and everyone else. Visuals are great for identifying gaps.
Delivery can also be a tool for learning. If you track data and avoid falling into the ship-and-forget trap, delivery can reveal significant insights. But is it the fastest / cheapest method of learning? That's the million-dollar question, that also happens to be very context-dependent.
Extra resources:
- Linear Regression and Correlation Analysis
- Using Google Sheets
CORRELfunction to compare datasets - Opportunity Solution Trees – Mapping opportunities
Constant whiplash – (Context switching)
When problems rise to the surface, they often demand attention and pull us away from our current focus. Since there are real costs to context switching, it requires balance and discipline to ensure everything doesn't grind to a halt.
Fixing the problem
The tree can be used to evaluate trade-offs. When problems arise, compare the areas of the tree that are negatively impacted to areas positively affected by goals.
As an example, if there are goals in place to improve retention, and someone raises a red flag that new subscribers are currently down. Note it and determine if addressing the problem right now is worth paying the context switching costs.
The same can be done if you're in an environment where opportunities constantly present themselves and compete for attention.
Competing priorities – (Too many goals)
Much ink has been spilled on this topic so this section will focus on how KPI Trees can highlight the pain points and help communicate the problem clearly.
For more on this, see how there are real costs to context switching and ramping up on new initiatives.
Fixing the problem
Take one team or individual's goals and annotate the tree.
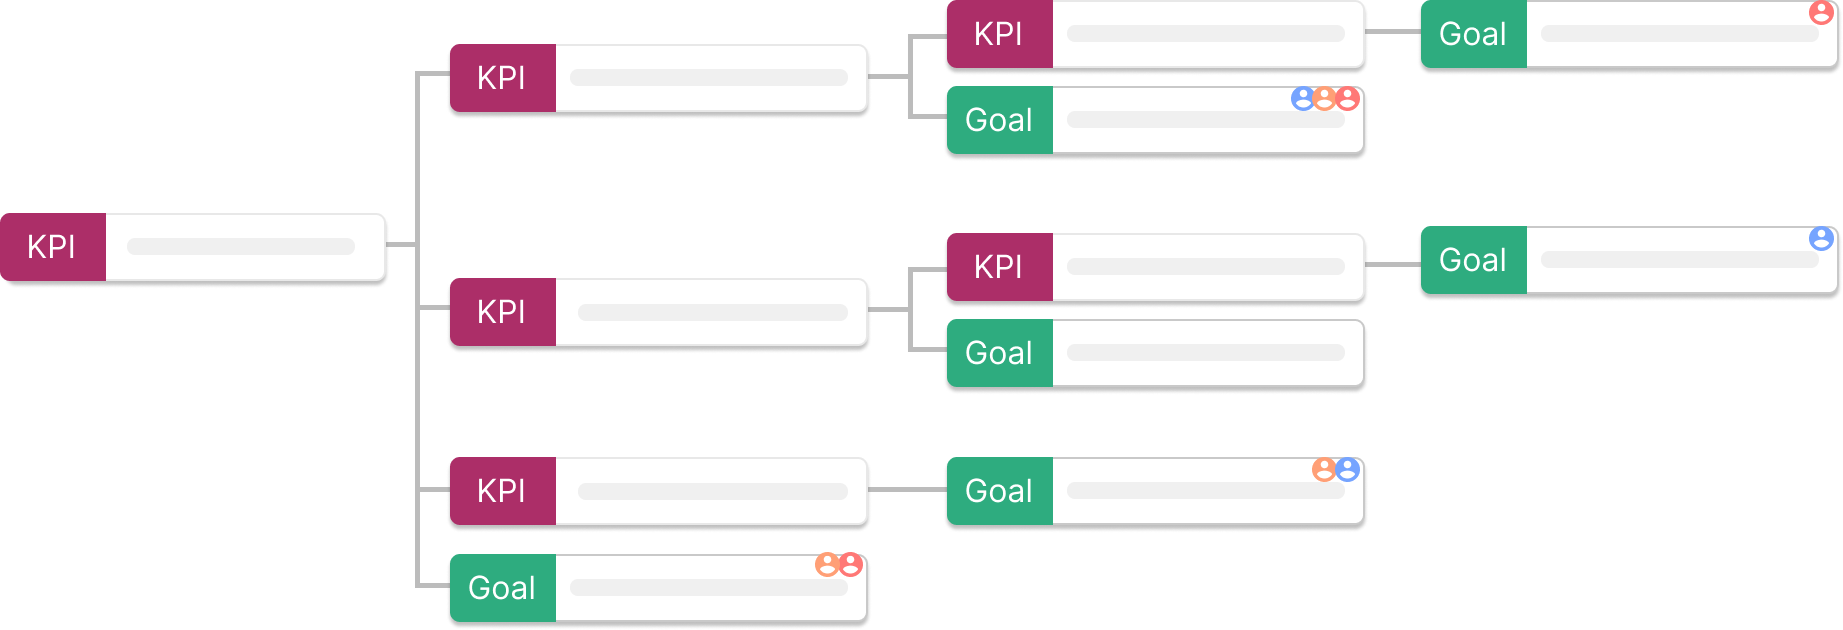
With the tree annotated and the goals sitting directly alongside why they matter, build consensus on where to apply focus. KPI Trees + Goals can make the evaluation of strategic priorities easier.
If you don't have control over assigning goals, you can still do the same exercise and use it to negotiate. Helping your team understand the costs of context switching helps build a case to improve focus.
Less is more. Later in this guide, there are popular metric frameworks that emphasize creating a singular point of focus to maximize impact.
Achieving goals that don't feel like wins (Task/Binary Goals)
When goals are either done or not done, they are tasks. If there is only one way to deliver the goal, it is a deliverable.
This kind of goal setting suffers from the same problems as "No correlation". If the task-based goals don't deliver value, or they are not the "right" solution to the "right" problem, the end result is a completed goal but an overall loss in time.
Fixing the problem
You have a solution in disguise when you can not use the tree to show multiple ways to address the goal.
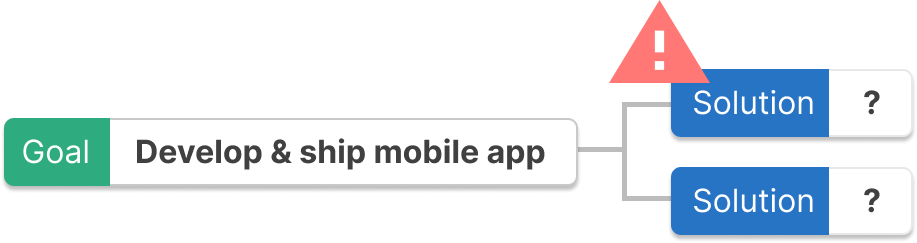
Try turning the goal into a solution and connecting it to an actual goal or metric in the tree.

When the real goal is clearly stated, is there is room to expand the problem space and learn more?
When done correctly, this tactic will open doors to other paths to achiving the same goal. Some which may save you time and money.
Popular metric & goal frameworks
There are a ton of frameworks and systems for setting goals and mapping metrics.
Metric frameworks
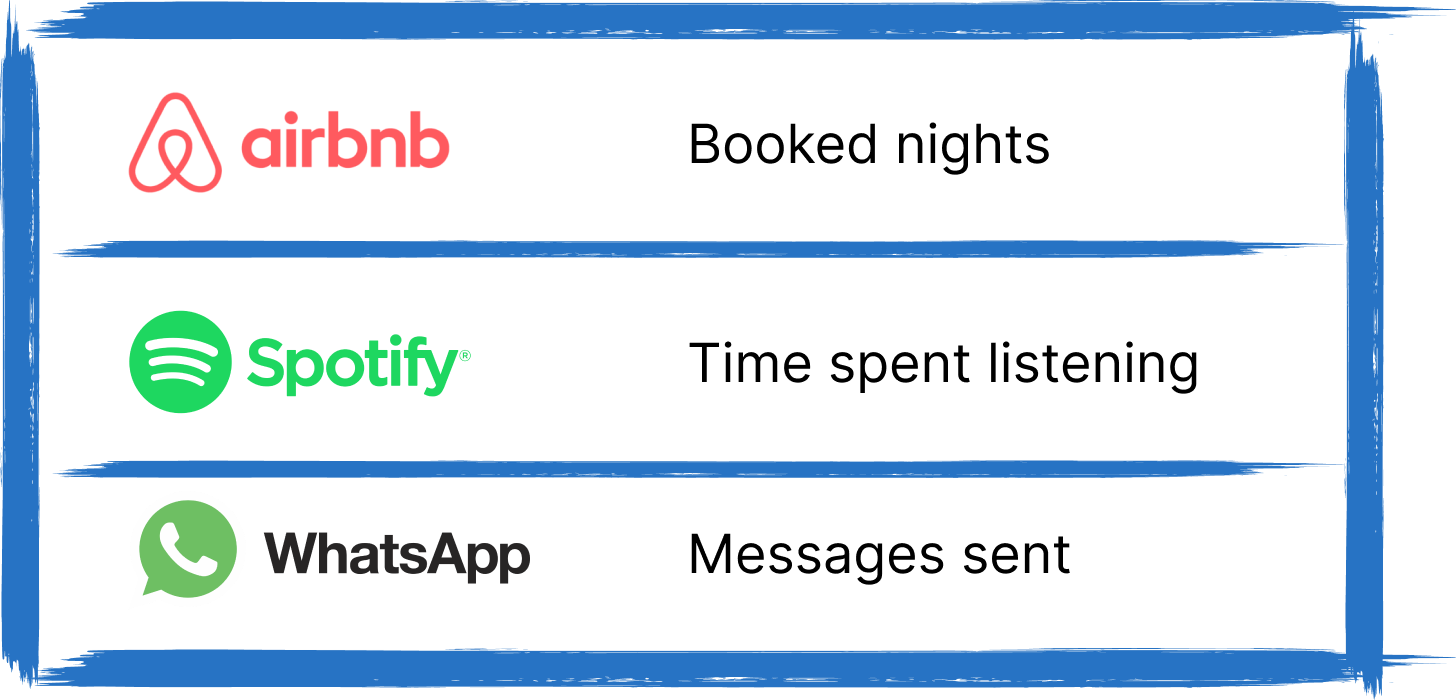
North Star Metrics (NSM)
This framework is typically used to capture one metric that communicates the value a product delivers to its customers.
Some well-known examples:
One Metric that Matters (OMTM)
OMTM is similar to North Star in that it helps create focus, but with some differences:
- More of a focus on business outcomes (compared to product value)
- Shorter length of focus. North Star metrics don't shift. OMTM is designed to shift as you move from the most important metric now to the next most important metric.
One example could be prioritizing user sign-ups for a month. Once that's improved, you may realize the conversion rate is not great and shift your focus.
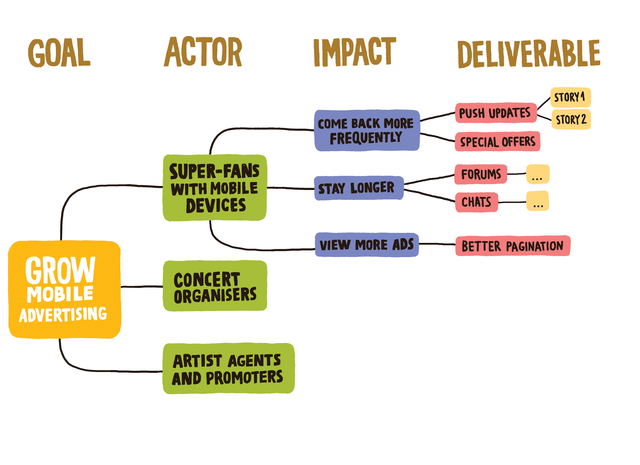
Impact Maps
"Impact maps show assumptions and a connection between business goals, impacts on users and stakeholders, and team deliverables."
KPI Trees
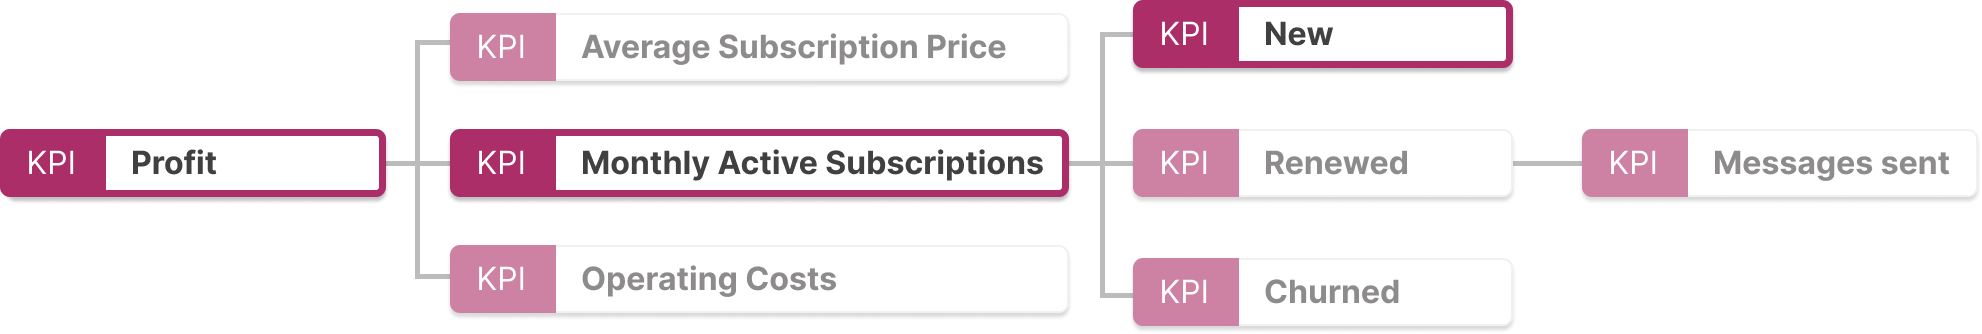
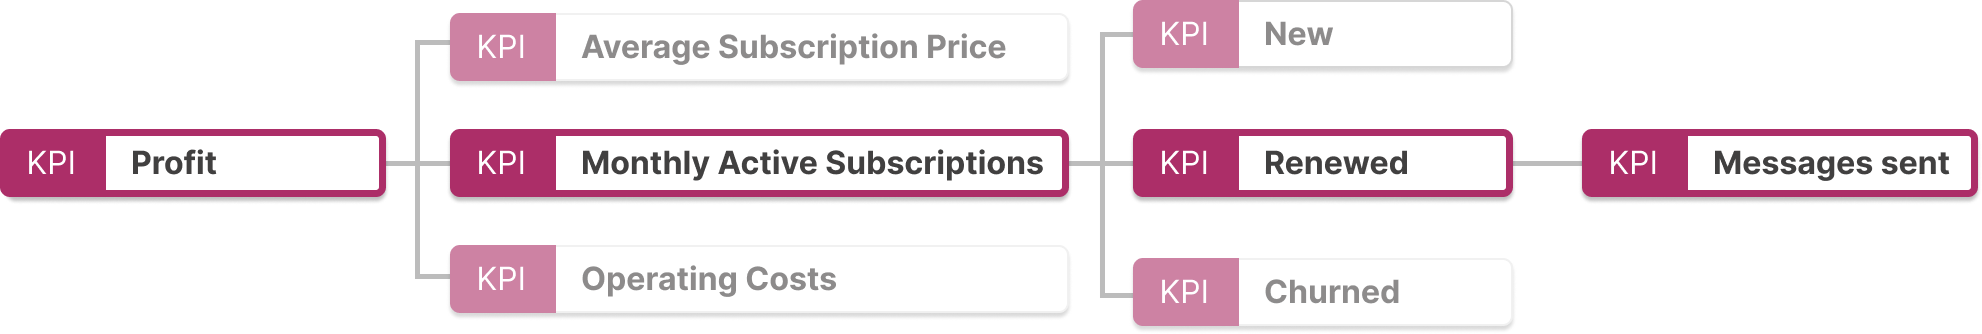
If you've read this guide, you're familiar with KPI Trees by now. You may also notice that many of the concepts above can be used together.
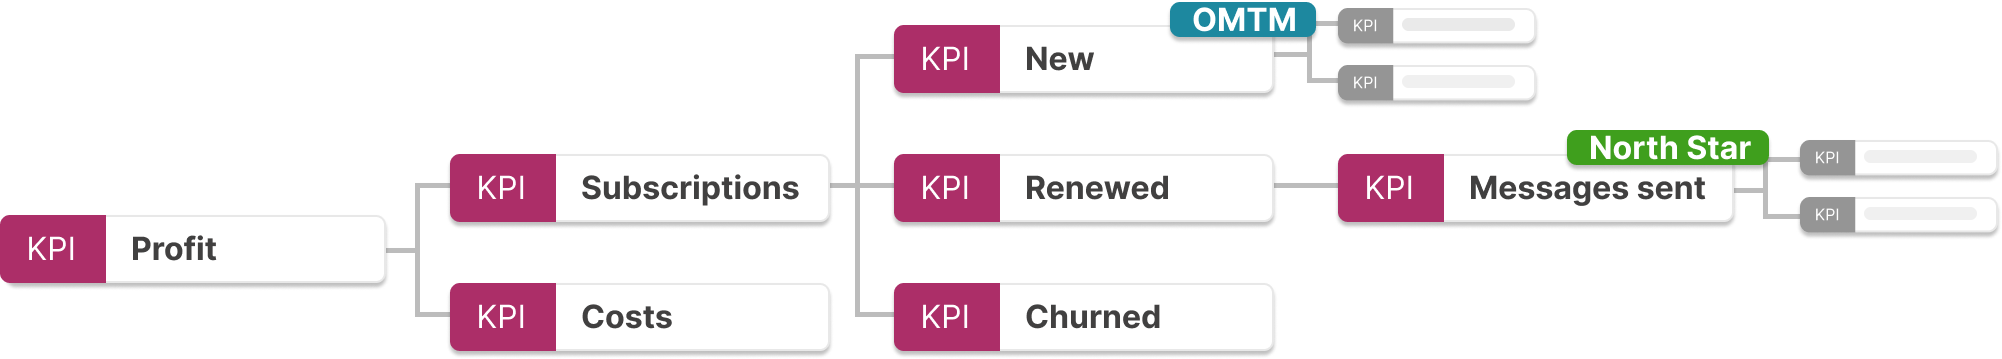
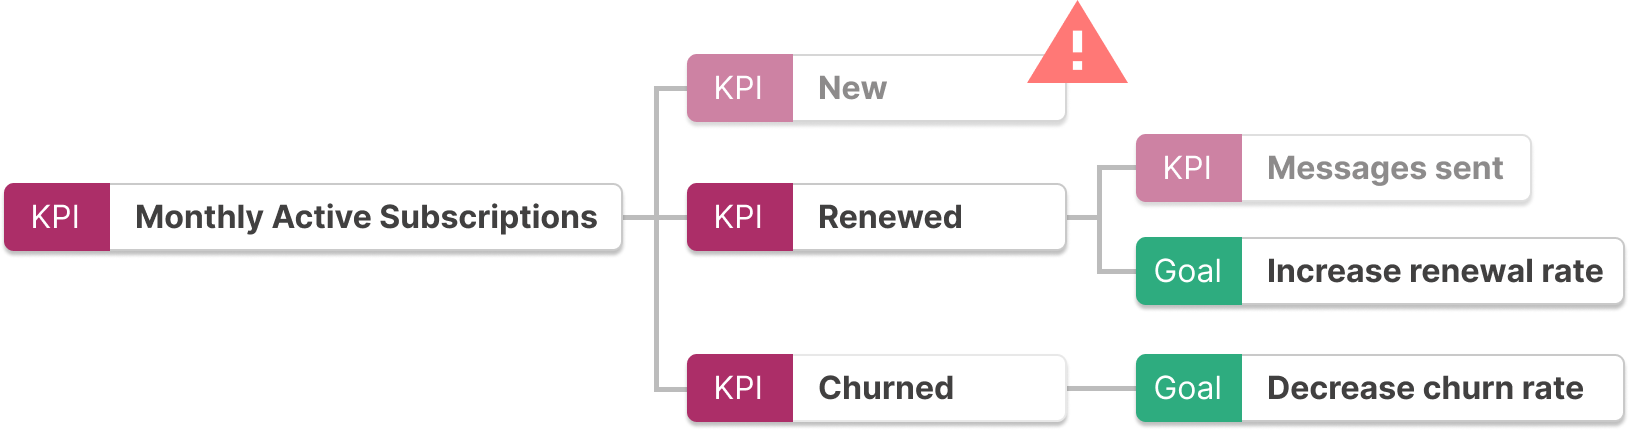
While the product North Star continues to be Messages sent, the current One Metric That Matters is increasing New Subscriptions.
Goal Frameworks
The following are some popular goal-based frameworks we see customers using. We've analyzed them to help piece together similarities and differences so you can determine how the visual mapping concepts outlined in this guide can apply to each.
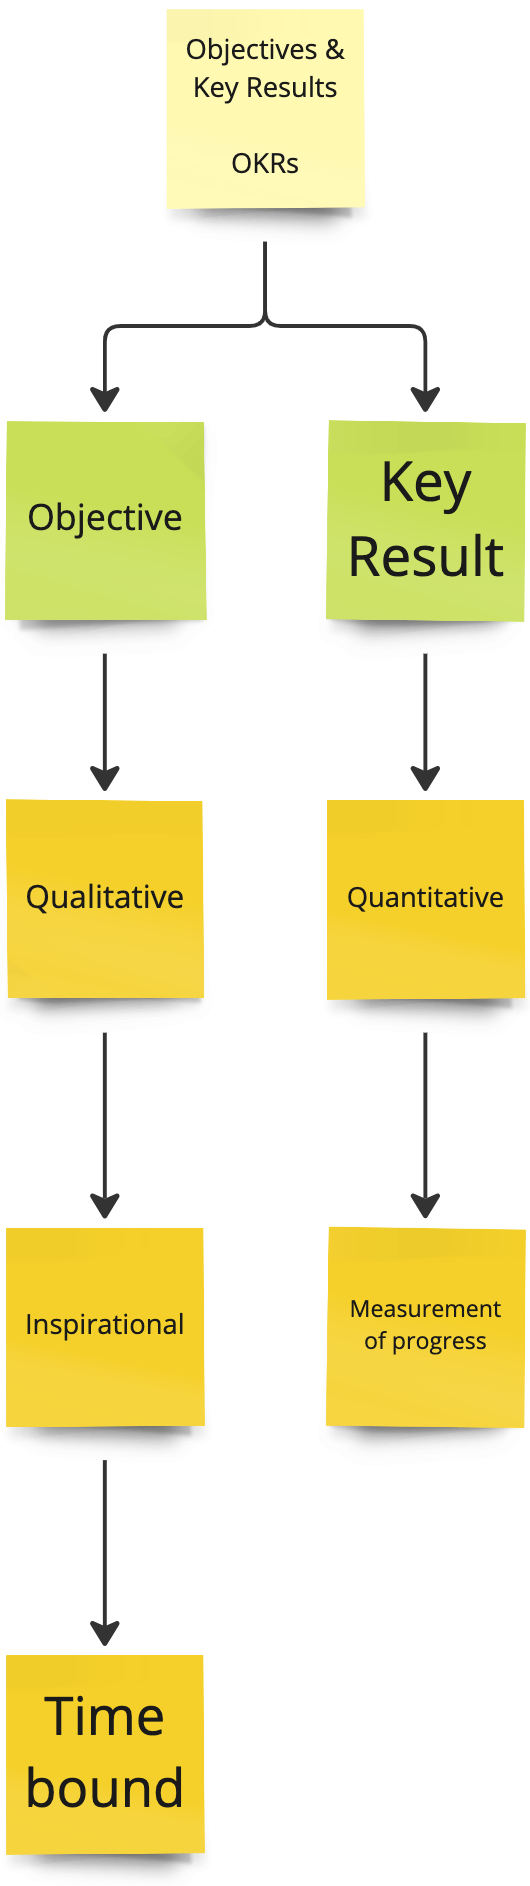
OKRs (Objectives & Key Results)
OKRs are one of the more popular goal-setting tools.
"OKRs are an effective goal-setting and leadership tool for communicating what you want to accomplish and what milestones you’ll need to meet in order to accomplish it."
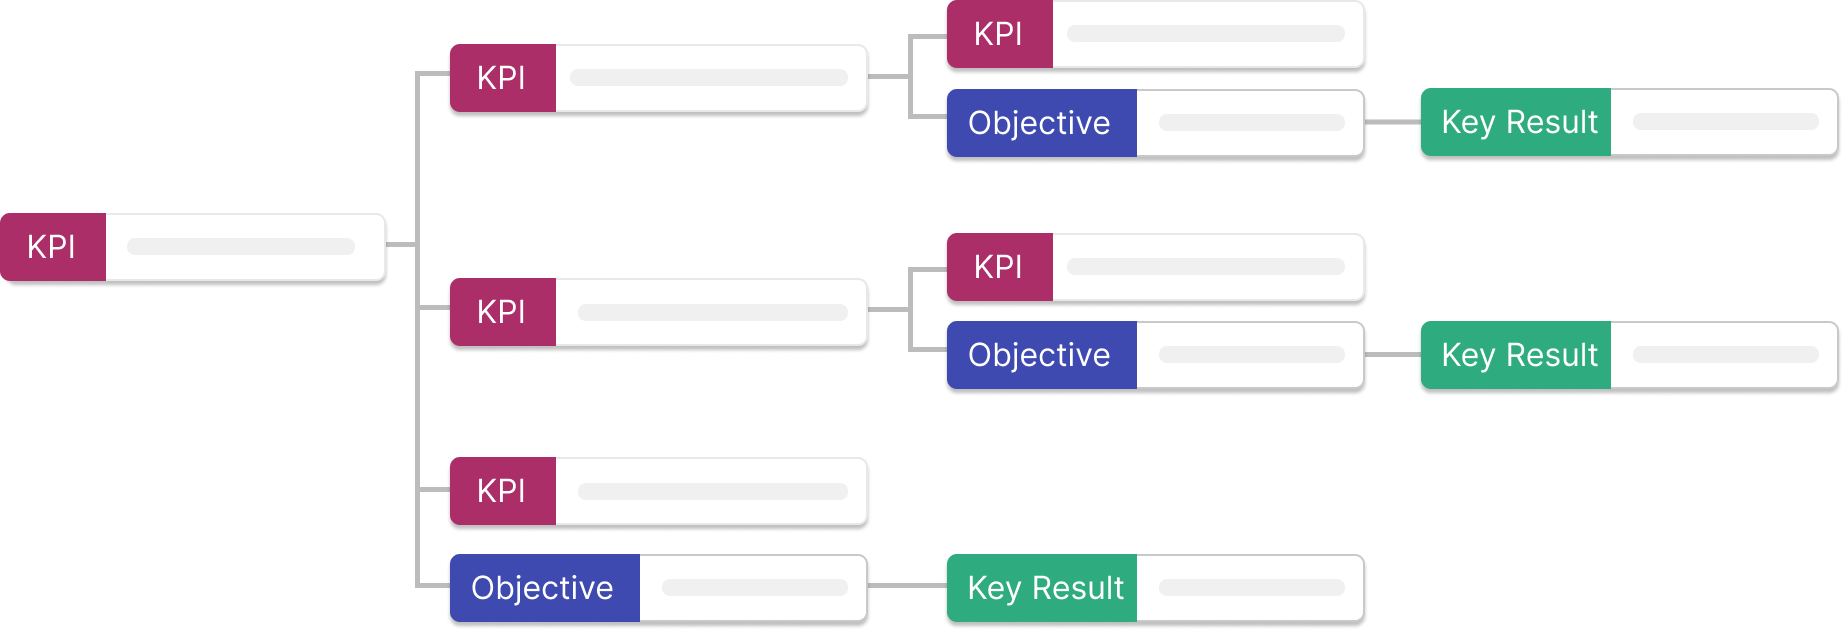
Bringing OKRs and KPI Trees together can look something like this.
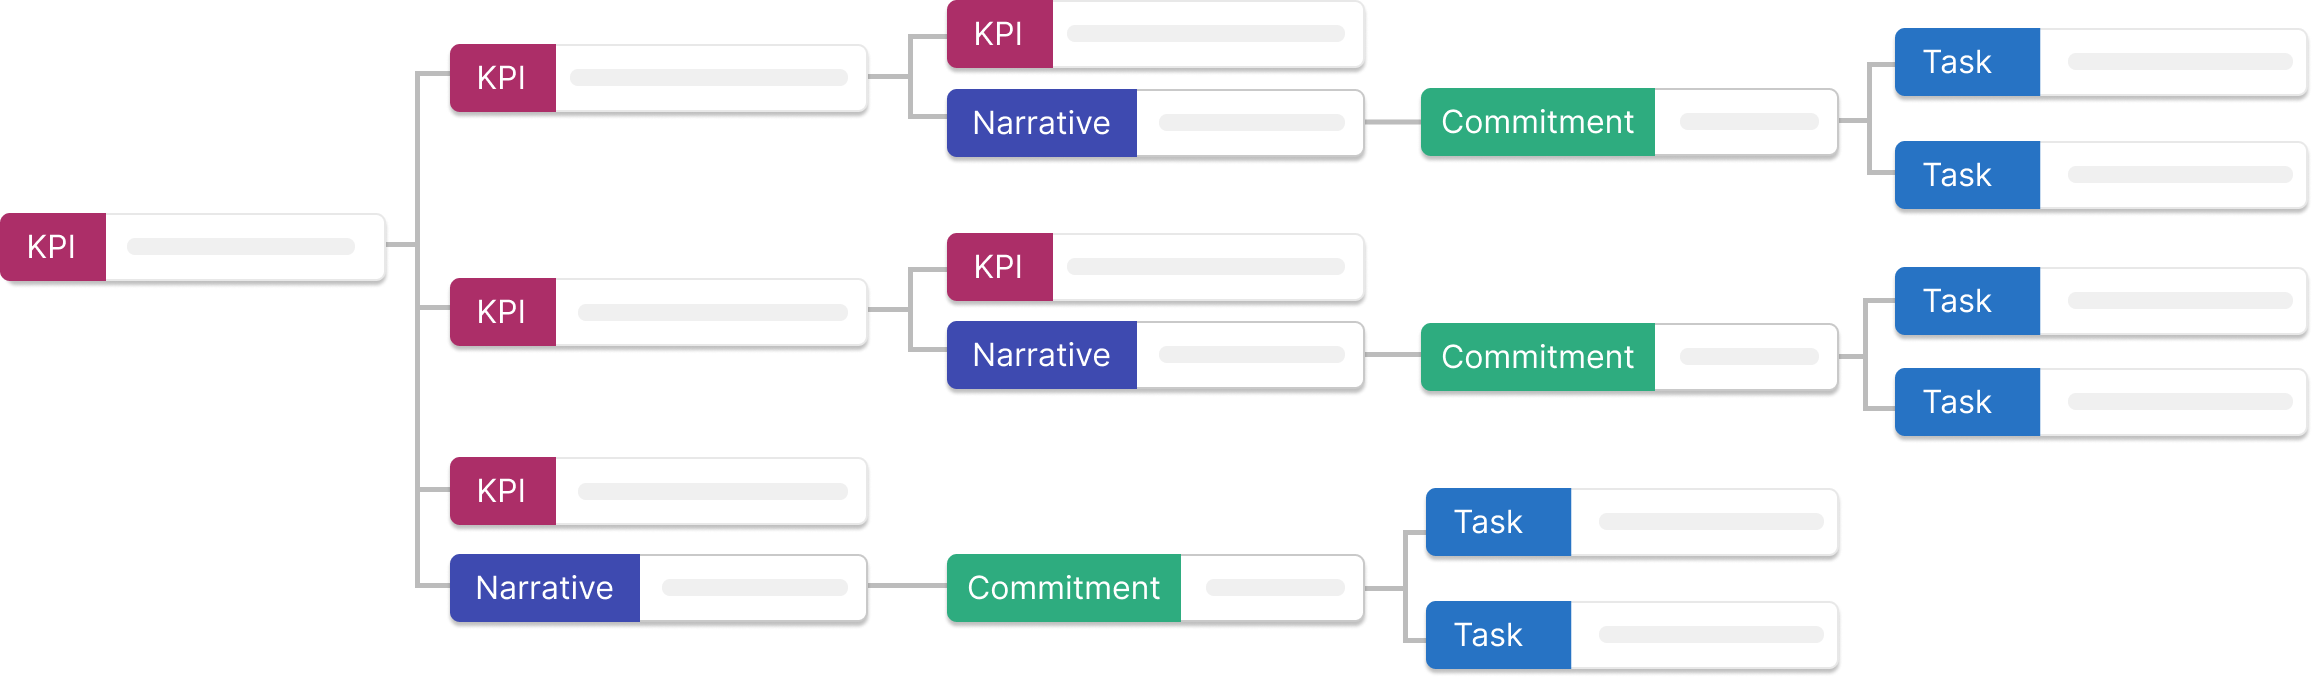
NCTs (Narratives, Commitments, and Tasks)
In many ways, NCTs are similar to OKRs, with opinionated views on how action fits into goal setting.
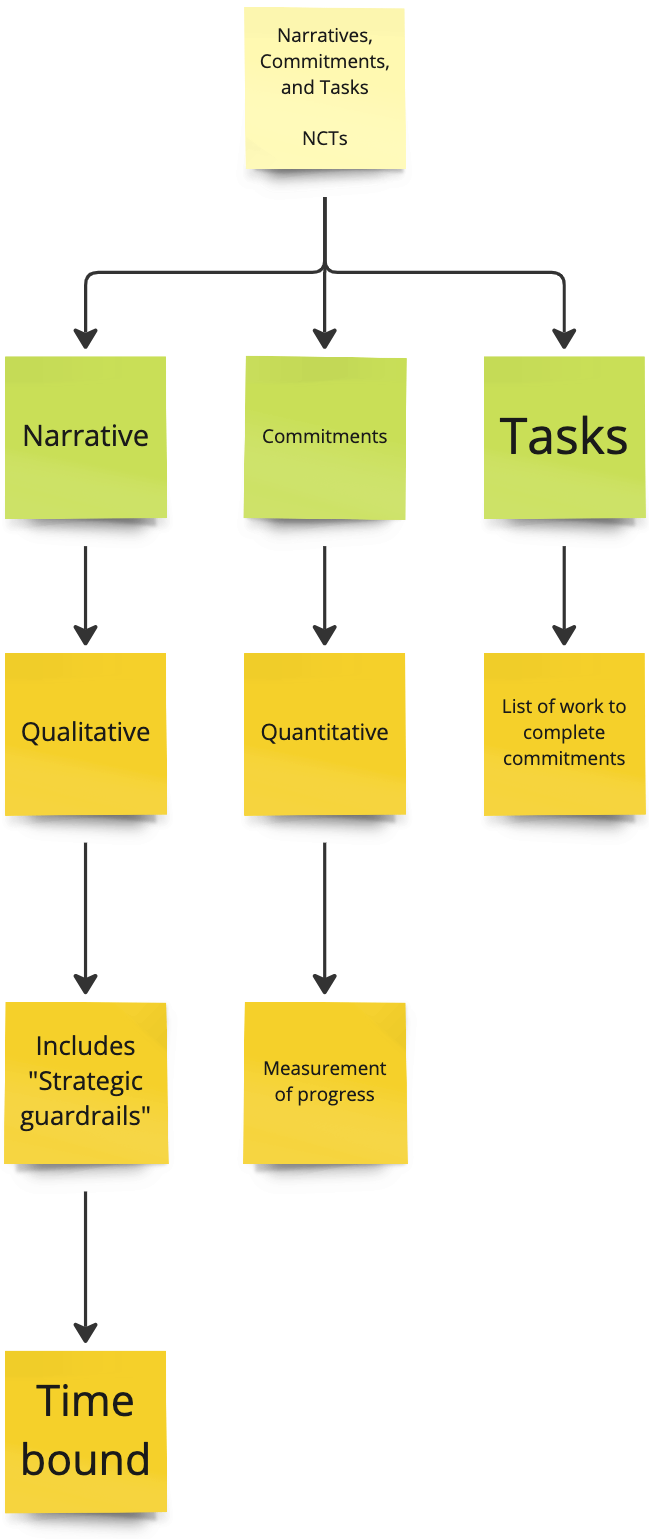
Bringing NCTs and KPI Trees together can look something like this.
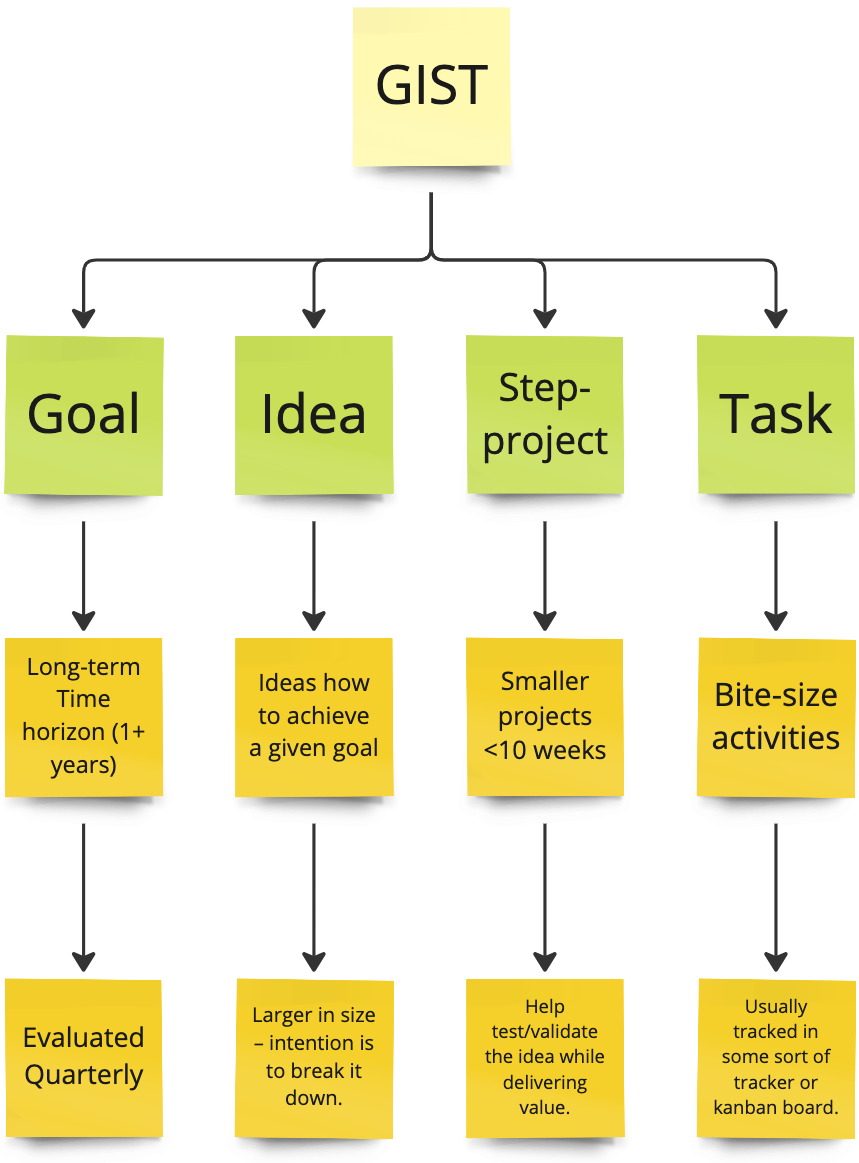
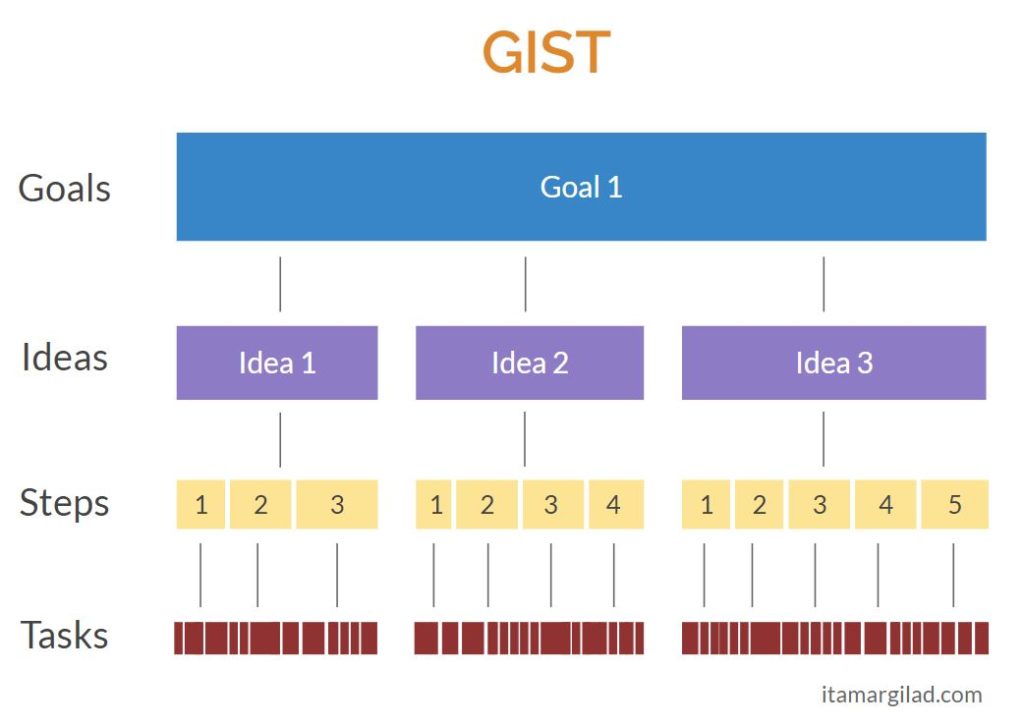
GIST
Gist is one part goal, three parts execution.
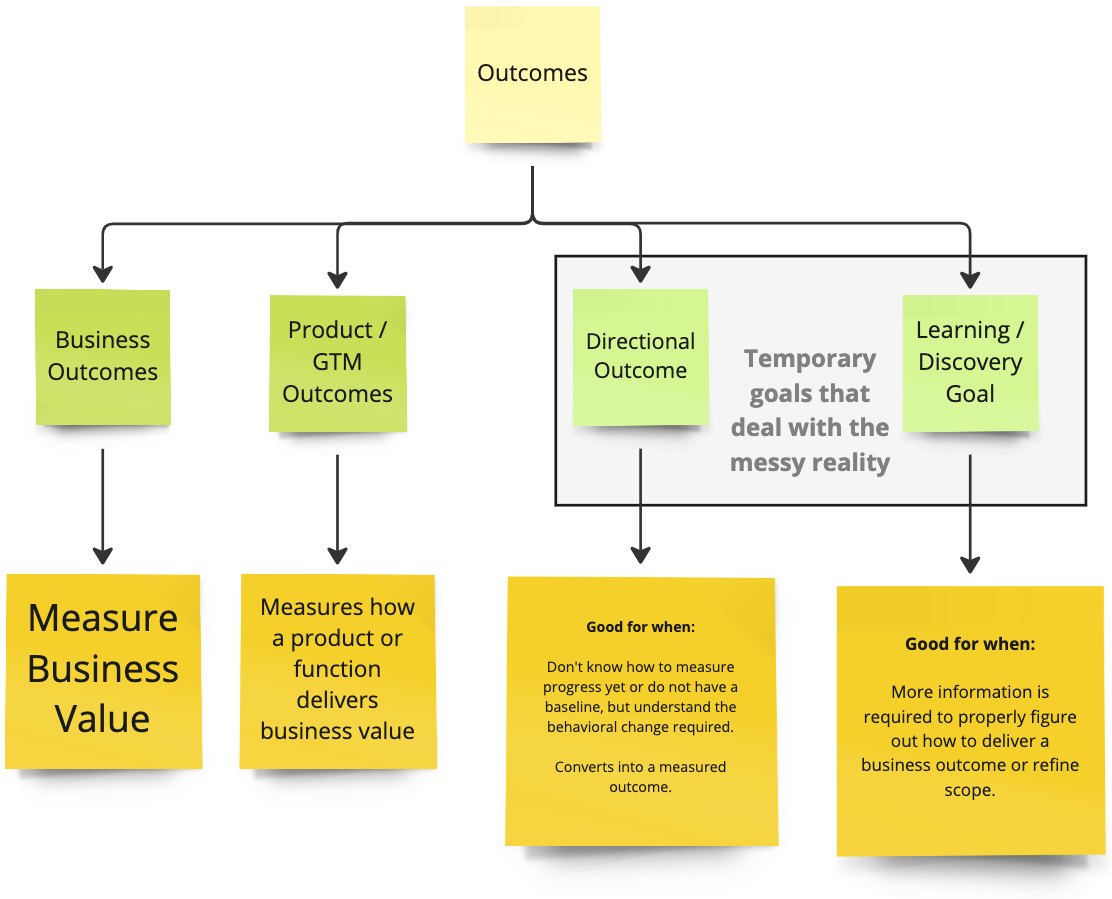
Business/Product Outcomes
If you've read Continuous Discovery Habits or follow ProductTalk's work, you may be familiar with the distinction between business and product outcomes. This distinction can solve some of the challenges mentioned above, like dealing with lagging metrics and minimizing cross-functional dependencies.
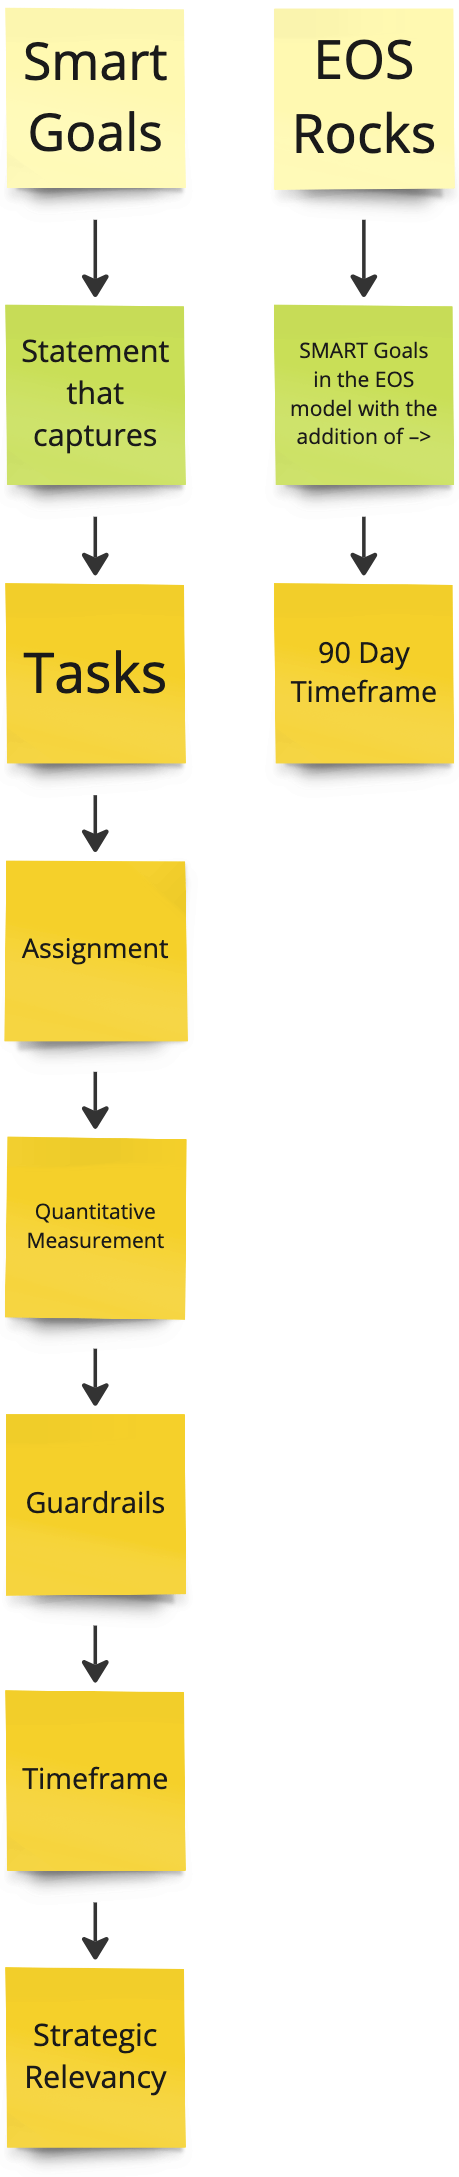
SMART Goals & EOS Rocks
SMART stands for Specific, Measurable, Achievable, Realistic, and Timely.
EOS stands for Entrepreneurial Operating System, which uses Rocks, which are SMART goals with parameters.
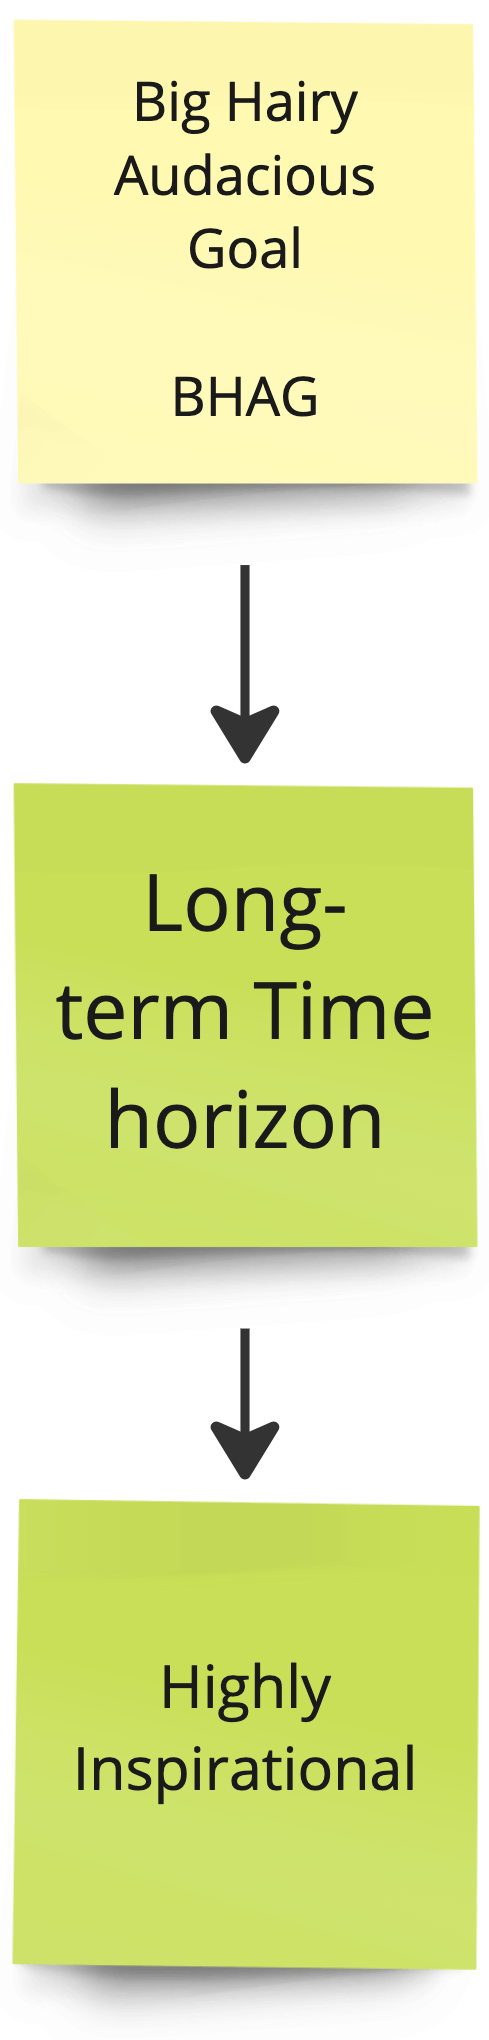
BHAG Big Hairy Audacious Goal
BHAG is one big goal that acts as the current singular focus. Similar to OMTM but with more inspiration. Jim Collins speaking on BHAG
Learn More
I hope you found this guide as valuable as we do working with customers. I plan on keeping this updated as we continue working with teams and learning more. If you have questions, feedback, or suggestions, send me an email at matt@vistaly.com.
If you're new to KPI Trees, I'd recommend also checking out Petra Wille & Shaun Russell's post for more information on getting started.
We're building Vistaly.com for product and go-to-market teams that want to own their metrics rather than the other way around. Most teams have dashboards for data and tools for tracking tasks. Vistaly bridges the gap between and brings order to the "messy middle" by making it visual.
If you're interested in learning more about Vistaly, request a free trial or schedule time to meet the team.